eCommerce: Amazon's Corporate Strategy
Amazon Business Segments: Top Domains, Prime & Seller Statistics
Amazon is best known for its eCommerce business, which includes its marketplace and online store. But what other businesses does the conglomerate manage? Here is how Amazon makes its money.
Article by Nadine Koutsou-Wehling | April 22, 2024
Amazon Business Segments: Key Insights
eCommerce Most Important: Amazon revenues by business segment reflect the significance of eCommerce to the conglomerate, with more than 70% of revenue coming from Amazon's online stores and marketplace in 2023.
Number One Domain Is Amazon.com: In both first-party net sales, where Amazon acts as the retailer, and third-party net sales, where Amazon earns a per-sale commission as the marketplace provider, amazon.com is the domain with the highest net sales and GMV (gross merchandise volume).
Prime Usage: Nearly 170 million users have Prime memberships in the United States alone, but Amazon seems to have trouble sustaining growth.
Amazon Seller Statistics: Most Amazon sellers use the platform as a supplement to their business. Amazon sellers can be both small and large businesses, they can sell products either directly to Amazon or to consumers through the online marketplace, and most products are sourced from China.
Amazon has shaped global eCommerce, even impacting online stores in countries where it doesn’t operate. The “Amazonization” of online shopping means taking a consumer-centric approach that emphasizes immediacy and convenience.
With the exception of China, one of the few markets where Amazon failed to gain a foothold, Amazon operates around the world, serving more than 300 million customers and expanding through acquisitions and investments into other businesses such as cloud computing, subscription services, and various other areas.
Most of Amazon’s revenue, however, comes from eCommerce: selling products as a retailer and providing the marketplace platform for other companies to do the same. For this reason, ECDB presents the data related to Amazon’s retail business, subscription services and marketplace seller statistics.
Amazon’s Business Segments
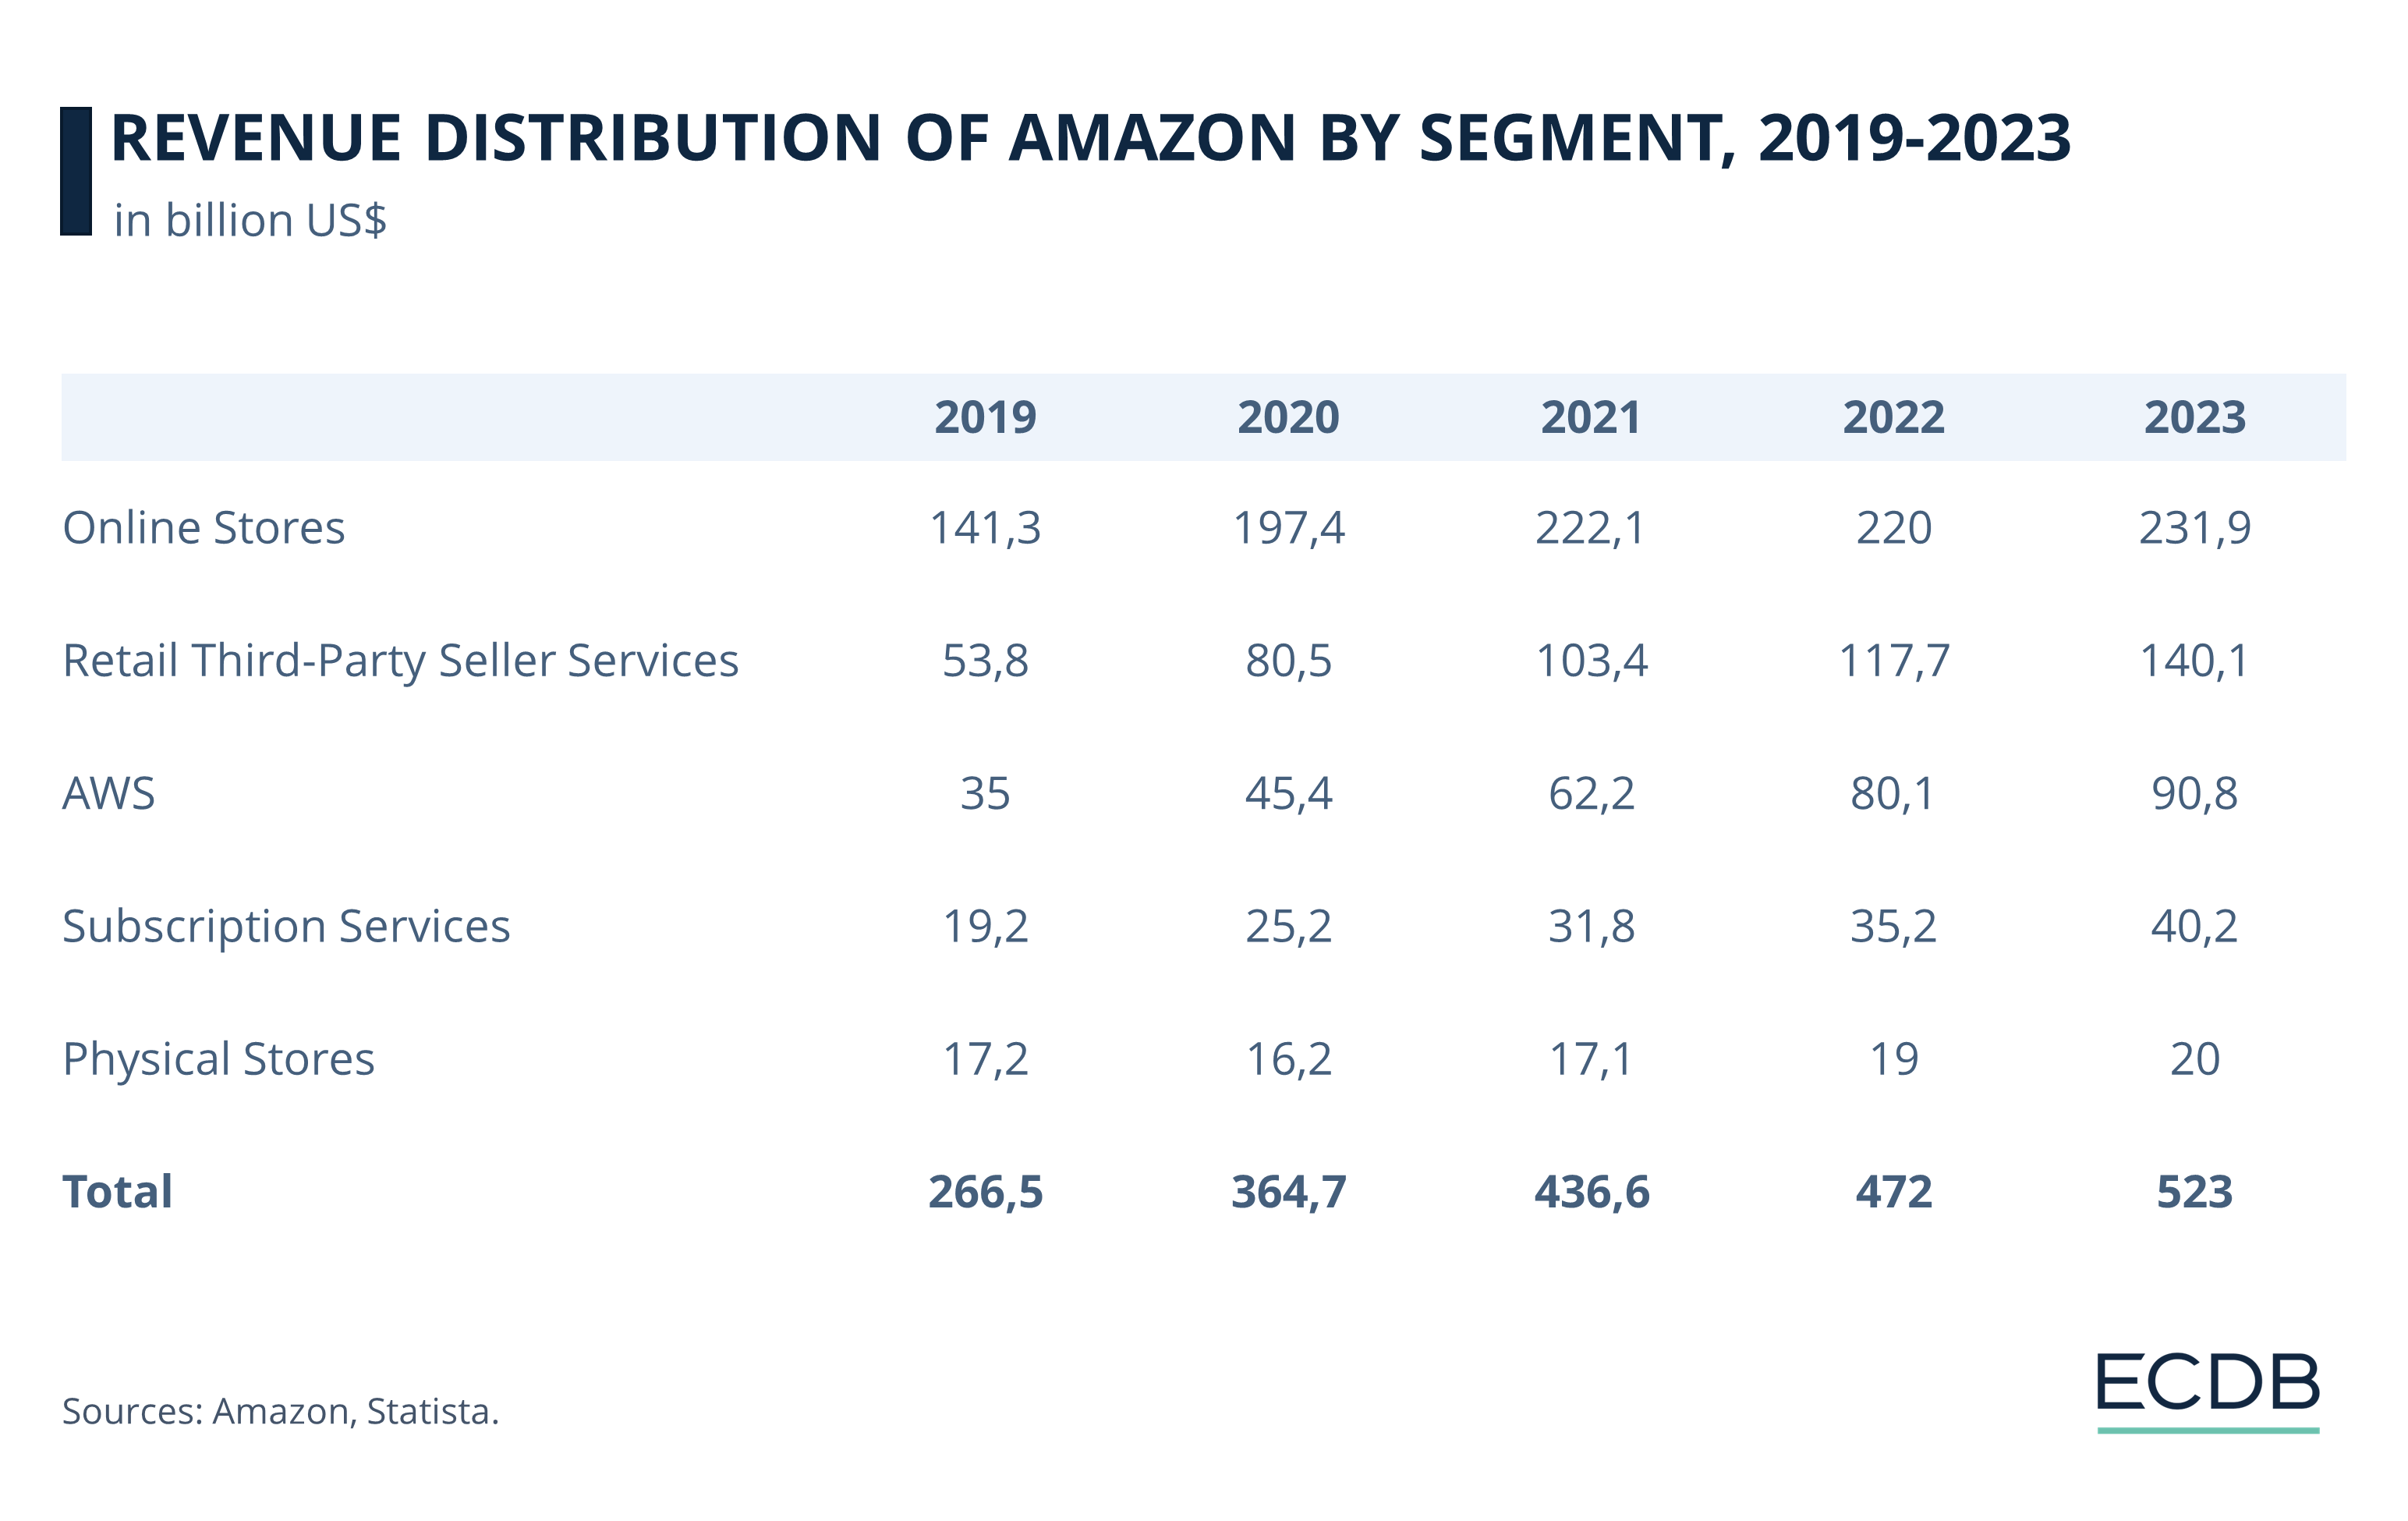
Amazon was one of the winners of the 2020 pandemic, as it was able to increase its revenues across all of its business segments. With revenues already substantial at US$267 billion in 2019, this figure reached US$523 billion by 2023, growing by an average of US$64 billion each year.
The company has a diverse portfolio of businesses, ensuring steady revenue streams and leveraging economies of scale to compete with other players in each area. Amazon’s competitiveness stems from the fact that it is known for offering the latest innovations at affordable prices.
Amazon’s online stores include its various international domains on the one hand, as well as numerous acquisitions the company has made over the years. In this way, Amazon is involved in relevant sectors of the economy, including fashion, technology, groceries, and much more. Amazon’s eCommerce net sales subsequently account for the largest share of its revenue, reaching 44% by 2023.
While Amazon has also ventured into physical store sales, such as its Amazon Go and Go Grocery stores, Amazon Fresh, and its subsidiary Whole Foods Market, it is clear that the conglomerate’s primary business is online. In particular, Amazon’s online marketplace stands out, where third-party retailers sell their products and Amazon earns a commission for providing technology and related services. In 2023, Amazon generated US$140 billion from these commissions, and the marketplace’s gross merchandise volume (GMV) points to continued growth, but more on that later.
Subscription services and AWS (Amazon Web Services), its cloud computing arm, make up the remaining quarter of revenues.
Amazon.com Is the Best-Selling Domain
Amazon’s online net sales across all of its domains account for the largest share of revenue, so they are worth breaking down. The top 10 Amazon domains by eCommerce net sales are shown below:
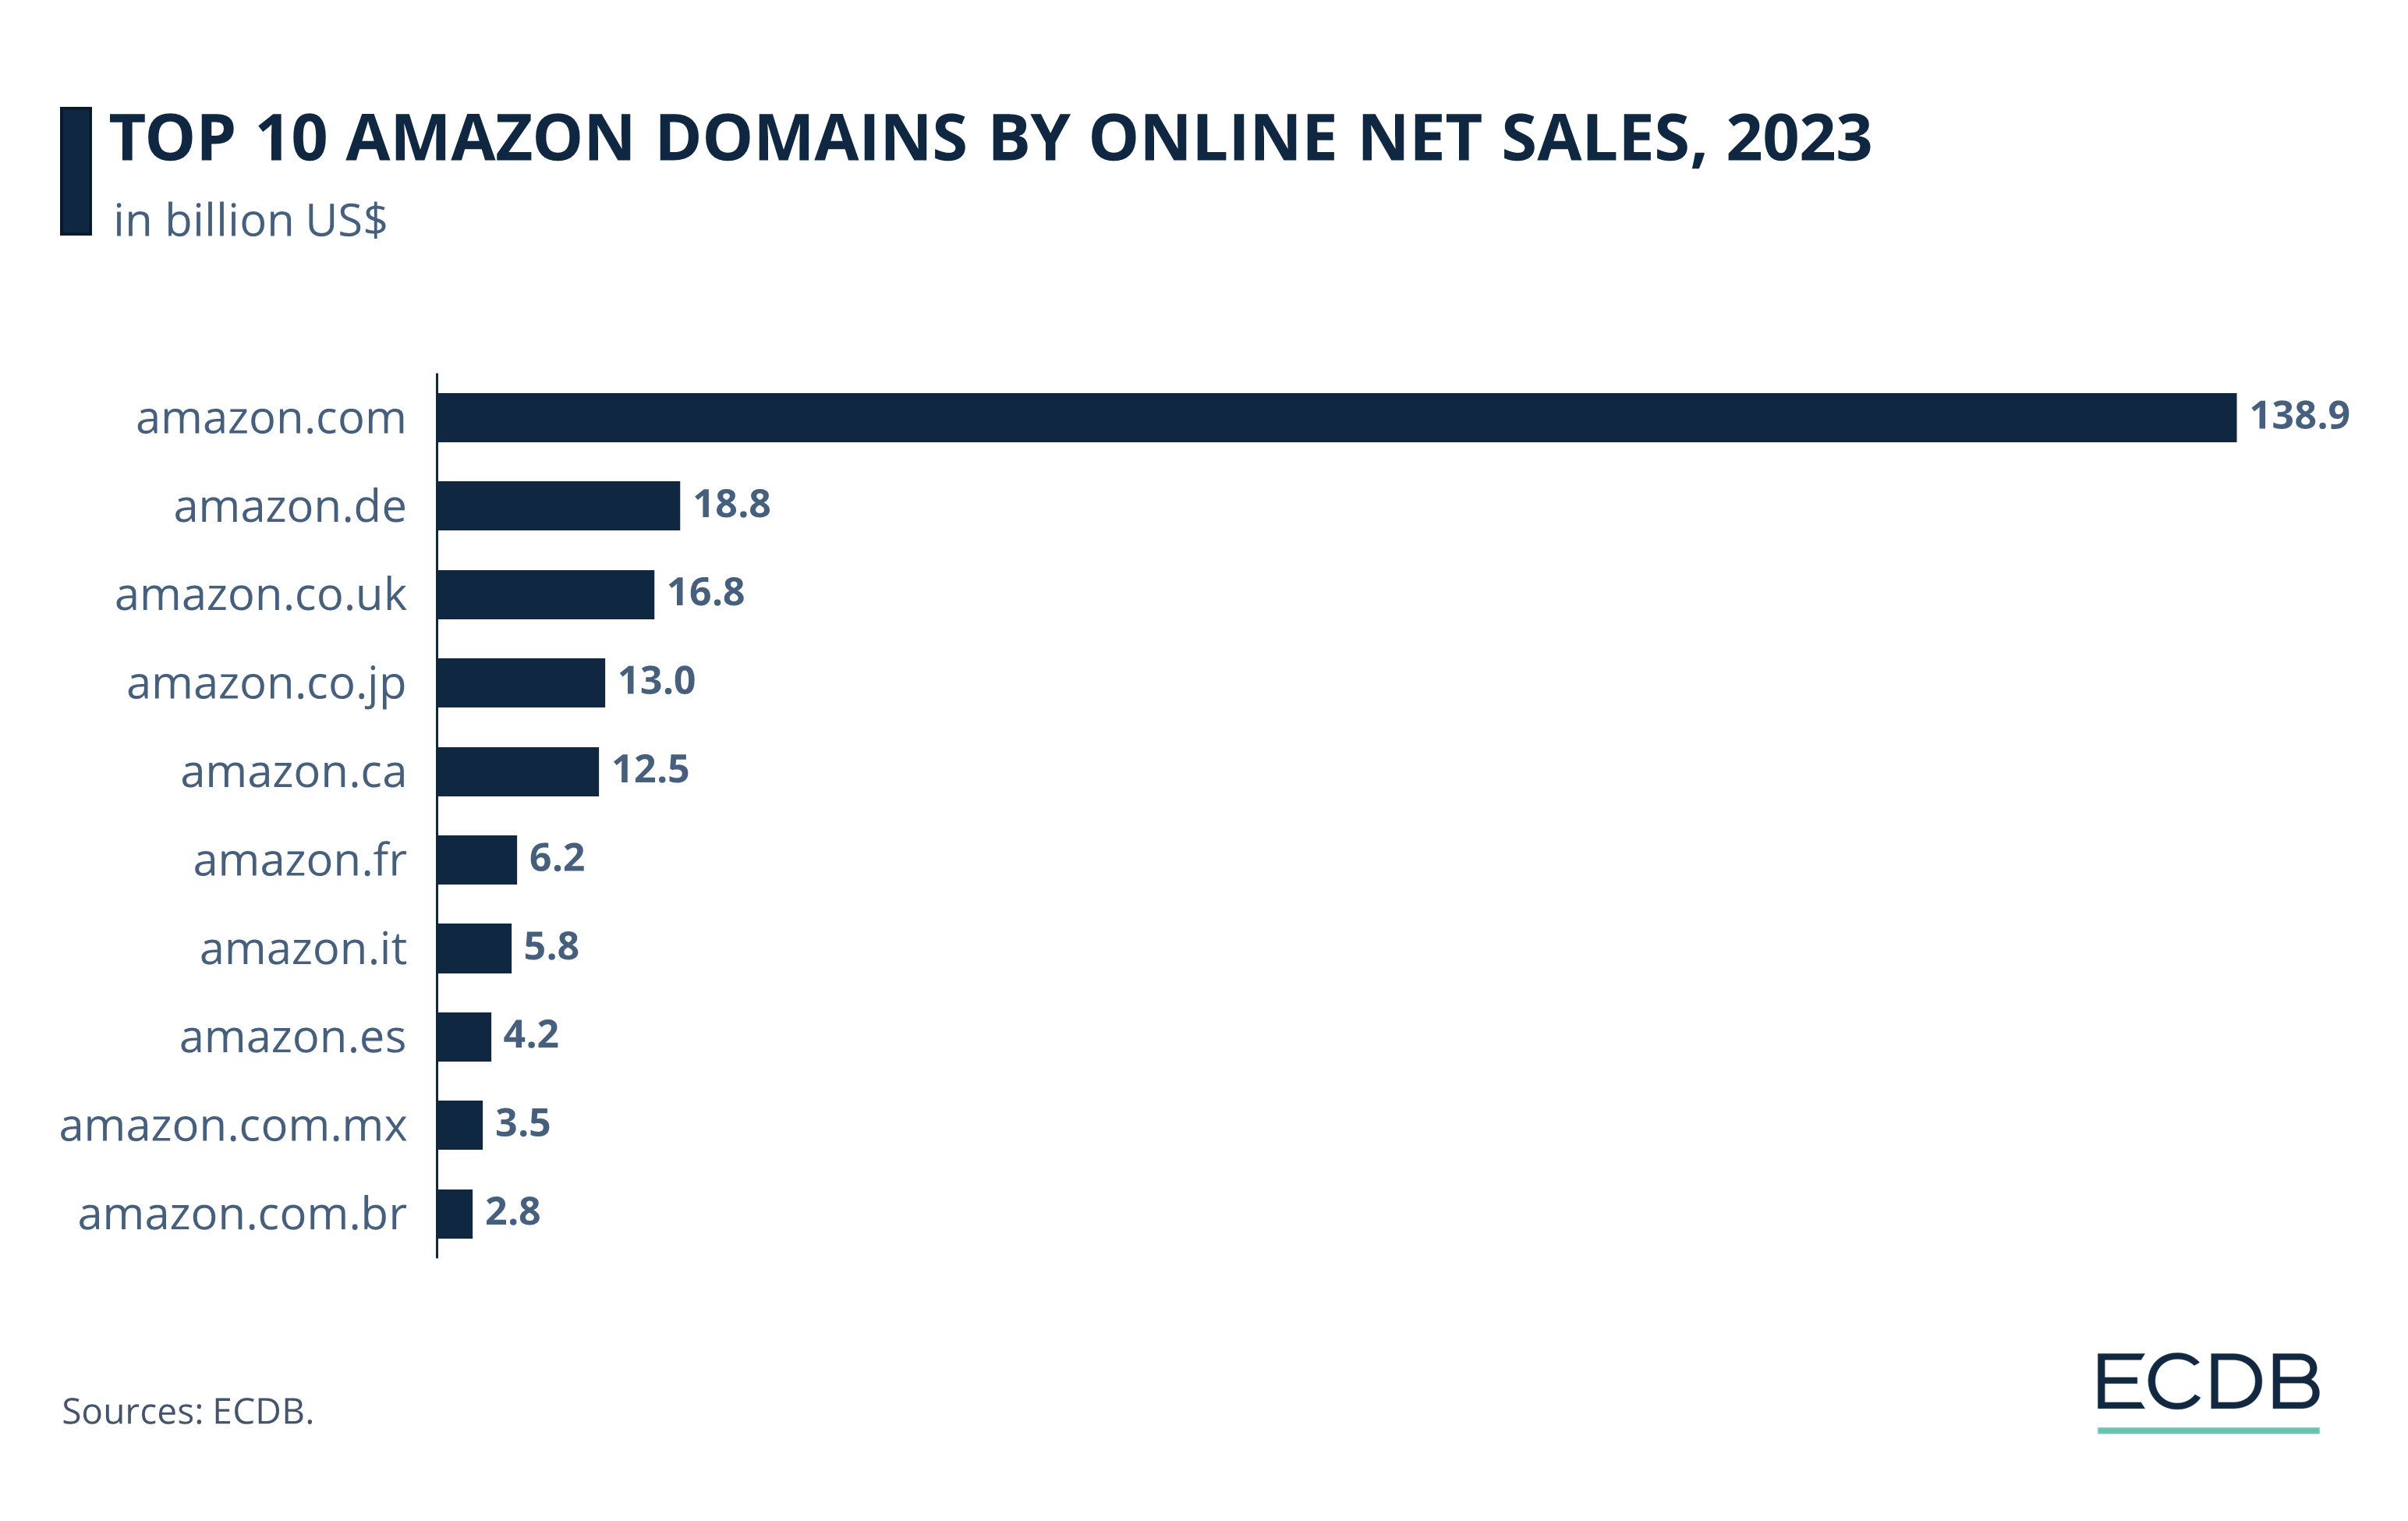
Amazon.com is the domain with the highest net sales, dwarfing the others with 2023 revenues of US$138.9 billion. The other markets generate only a fraction of this figure, with amazon.de in second place, approaching US$19 billion in online net sales.
The UK domain comes in third (US$16.8 billion), followed by amazon.co.jp (US$13 billion) and amazon.ca (US$12.5), rounding out the top 5 Amazon domains by revenue.
The other half of Amazon’s top 10 domains consists of amazon.fr (US$6.2 billion), amazon.it (US$5.8 billion), amazon.es (US$4.2 billion), amazon.com.mx (US$3.5 billion), and amazon.com.br (US$2.8 billion).
Amazon.com Is Also Top Marketplace by GMV
Amazon also functions as a marketplace provider, whose performance is measured by GMV. It is a metric to gauge marketplace activity.
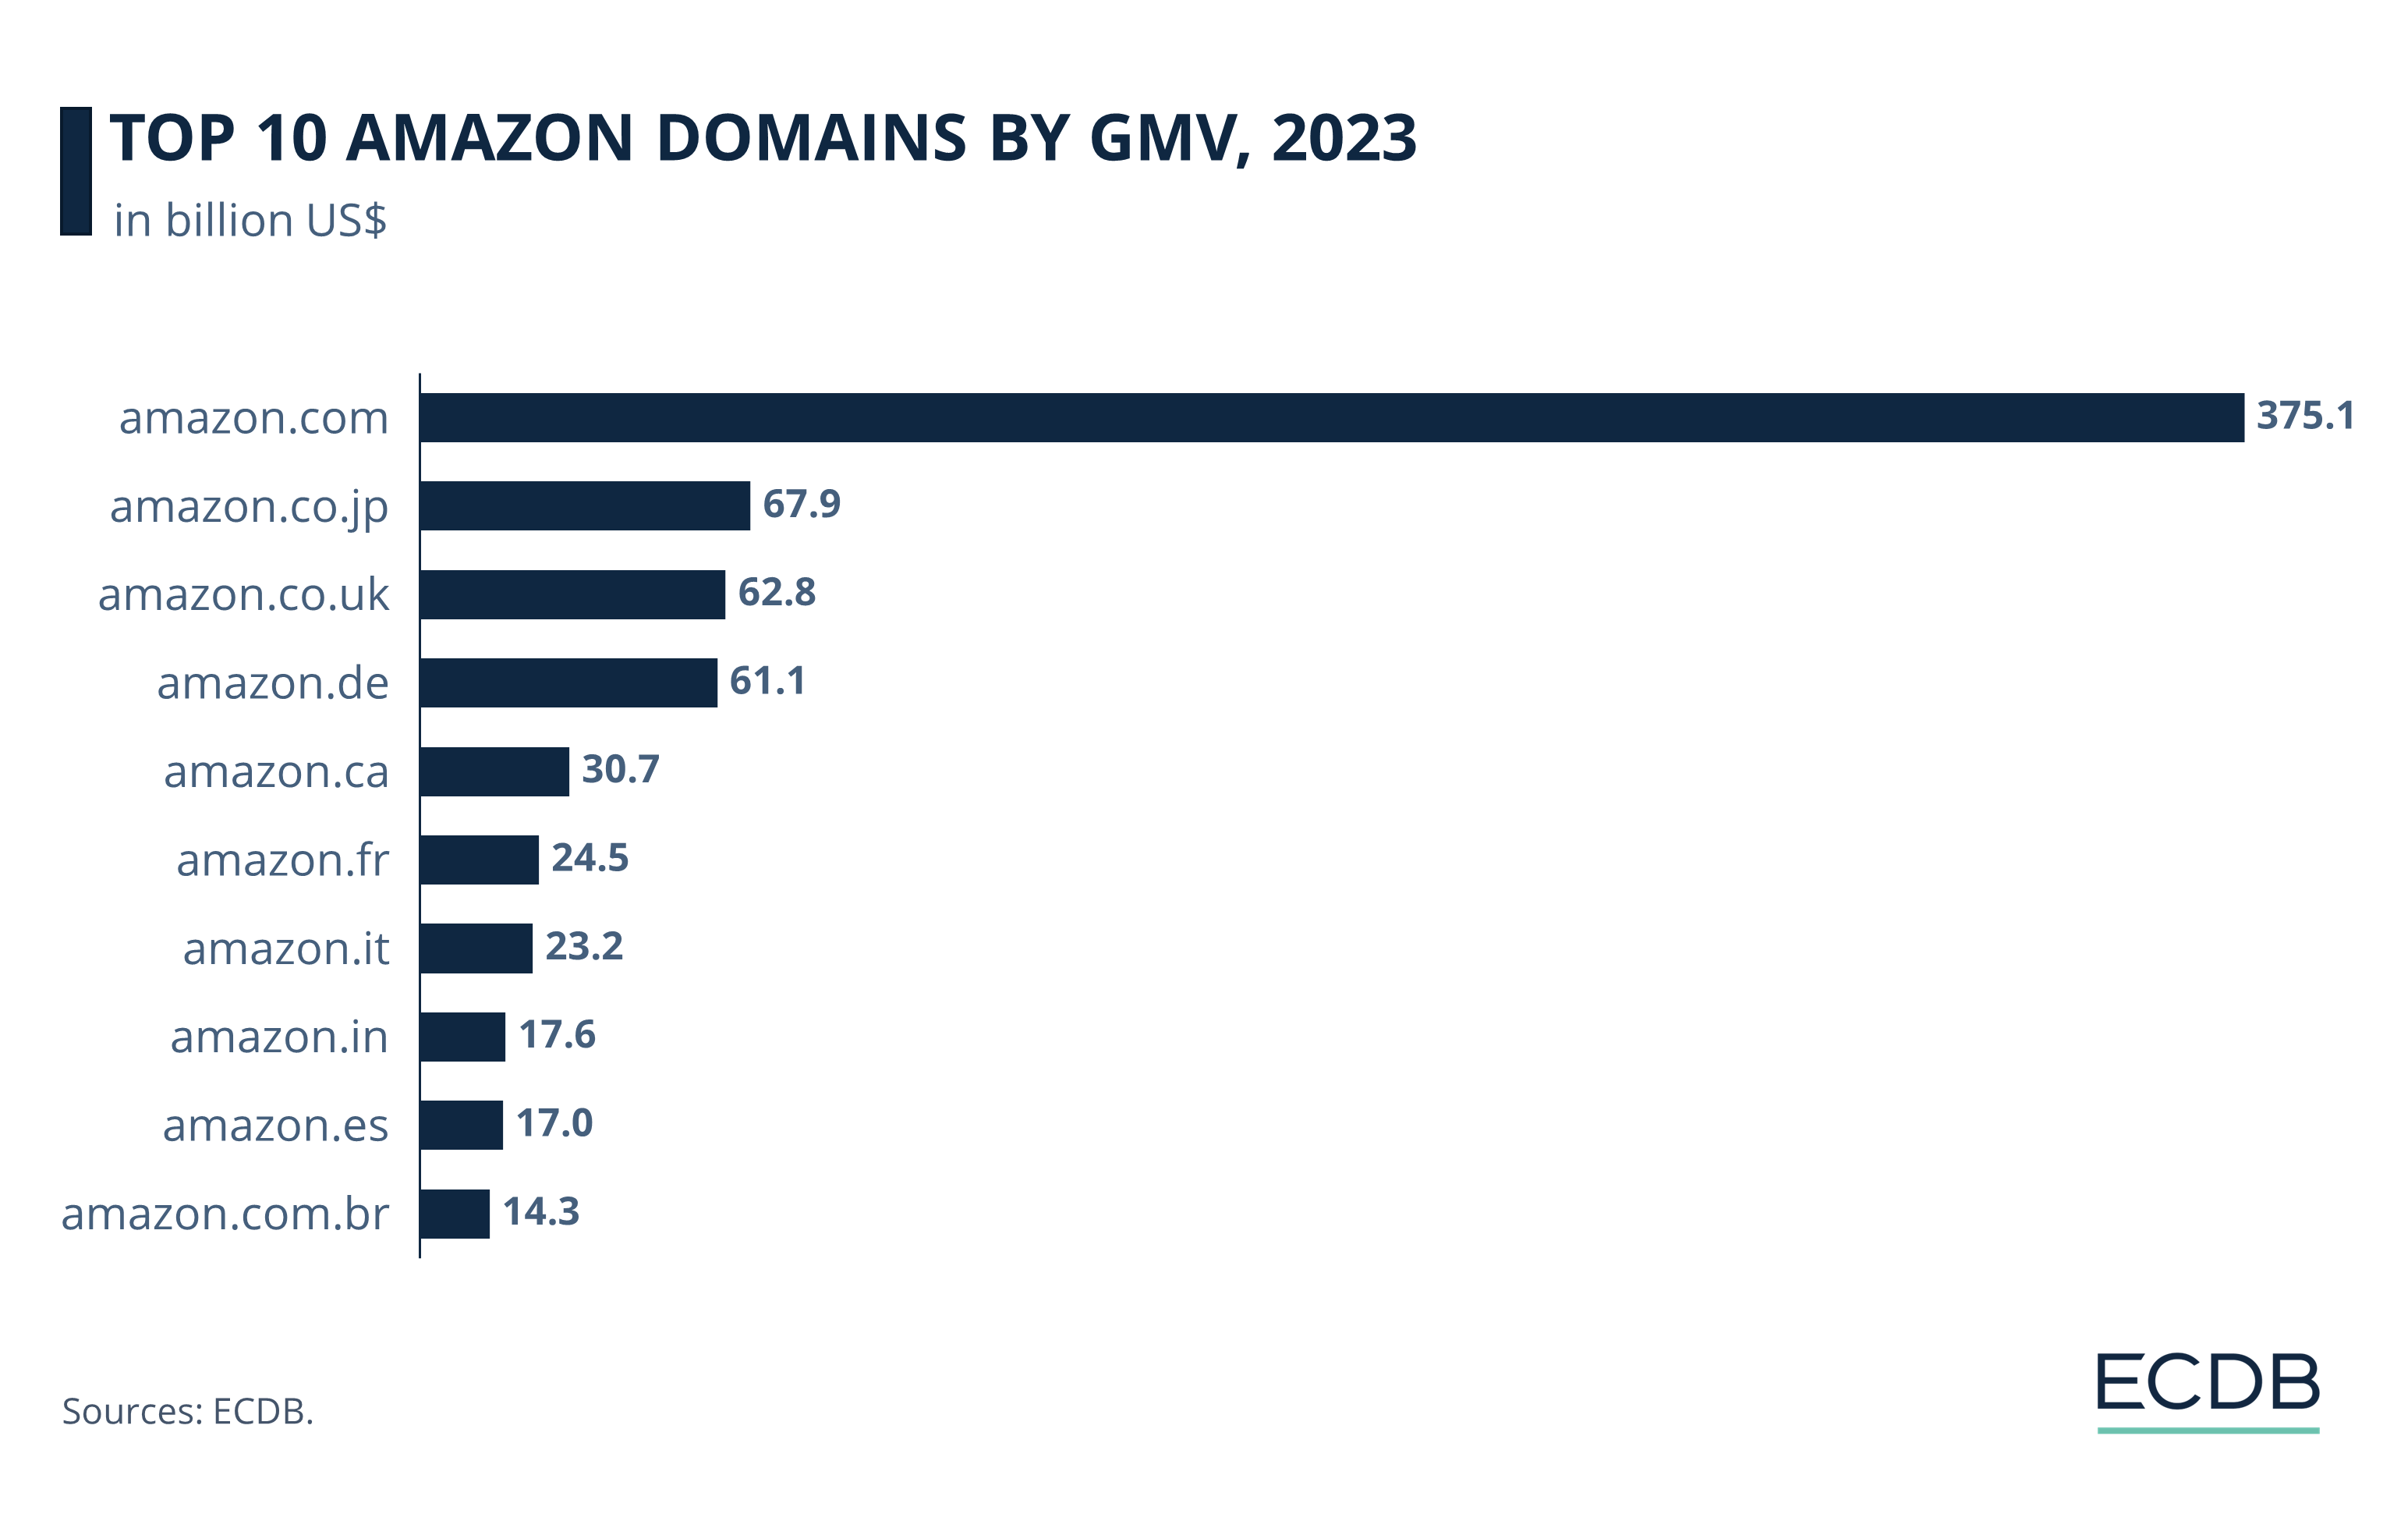
As with first-party net sales, amazon.com takes the lead as marketplace, with US$375.1 billion worth of products sold in 2023. This figure corresponds to the annual value of import and export revenues for countries like Vietnam.
Amazon.co.jp is the second largest Amazon marketplace by GMV, with US$67.9 billion in third-party sales in 2023, followed by amazon.co.uk in third place (US$62.8 billion). Amazon.de, which ranks second in first-party sales, is Amazon’s fourth largest marketplace with a GMV of US$61.1 billion. Fifth is amazon.ca, with a GMV of US$30.7 billion in 2023.
The remaining marketplaces in the top 10 by GMV are amazon.fr (US$24.5 billion), amazon.it (US$23.2 billion), amazon.in (US$17.6 billion), amazon.es (US$17 billion), and amazon.com.br (US$14.3 billion).
Amazon takes a per-sale commission as well as vendor services such as shipping, warehousing, and sales analytics. Therefore, although the GMV is higher than the online net sales in the previous section, Amazon earns a fraction of it for its function as a marketplace provider.
Shoppers receive extra benefits when they shop on Amazon with a Prime membership. What are the usage numbers for this service?
Nearly 170 Million Prime Members in the United States
A Prime membership offers delivery benefits, ad-free access to Prime Video, Prime Reading and Amazon Music, as well as Amazon Photos and Prime Gaming. The annual Prime Day discount event is a major driver of new memberships.
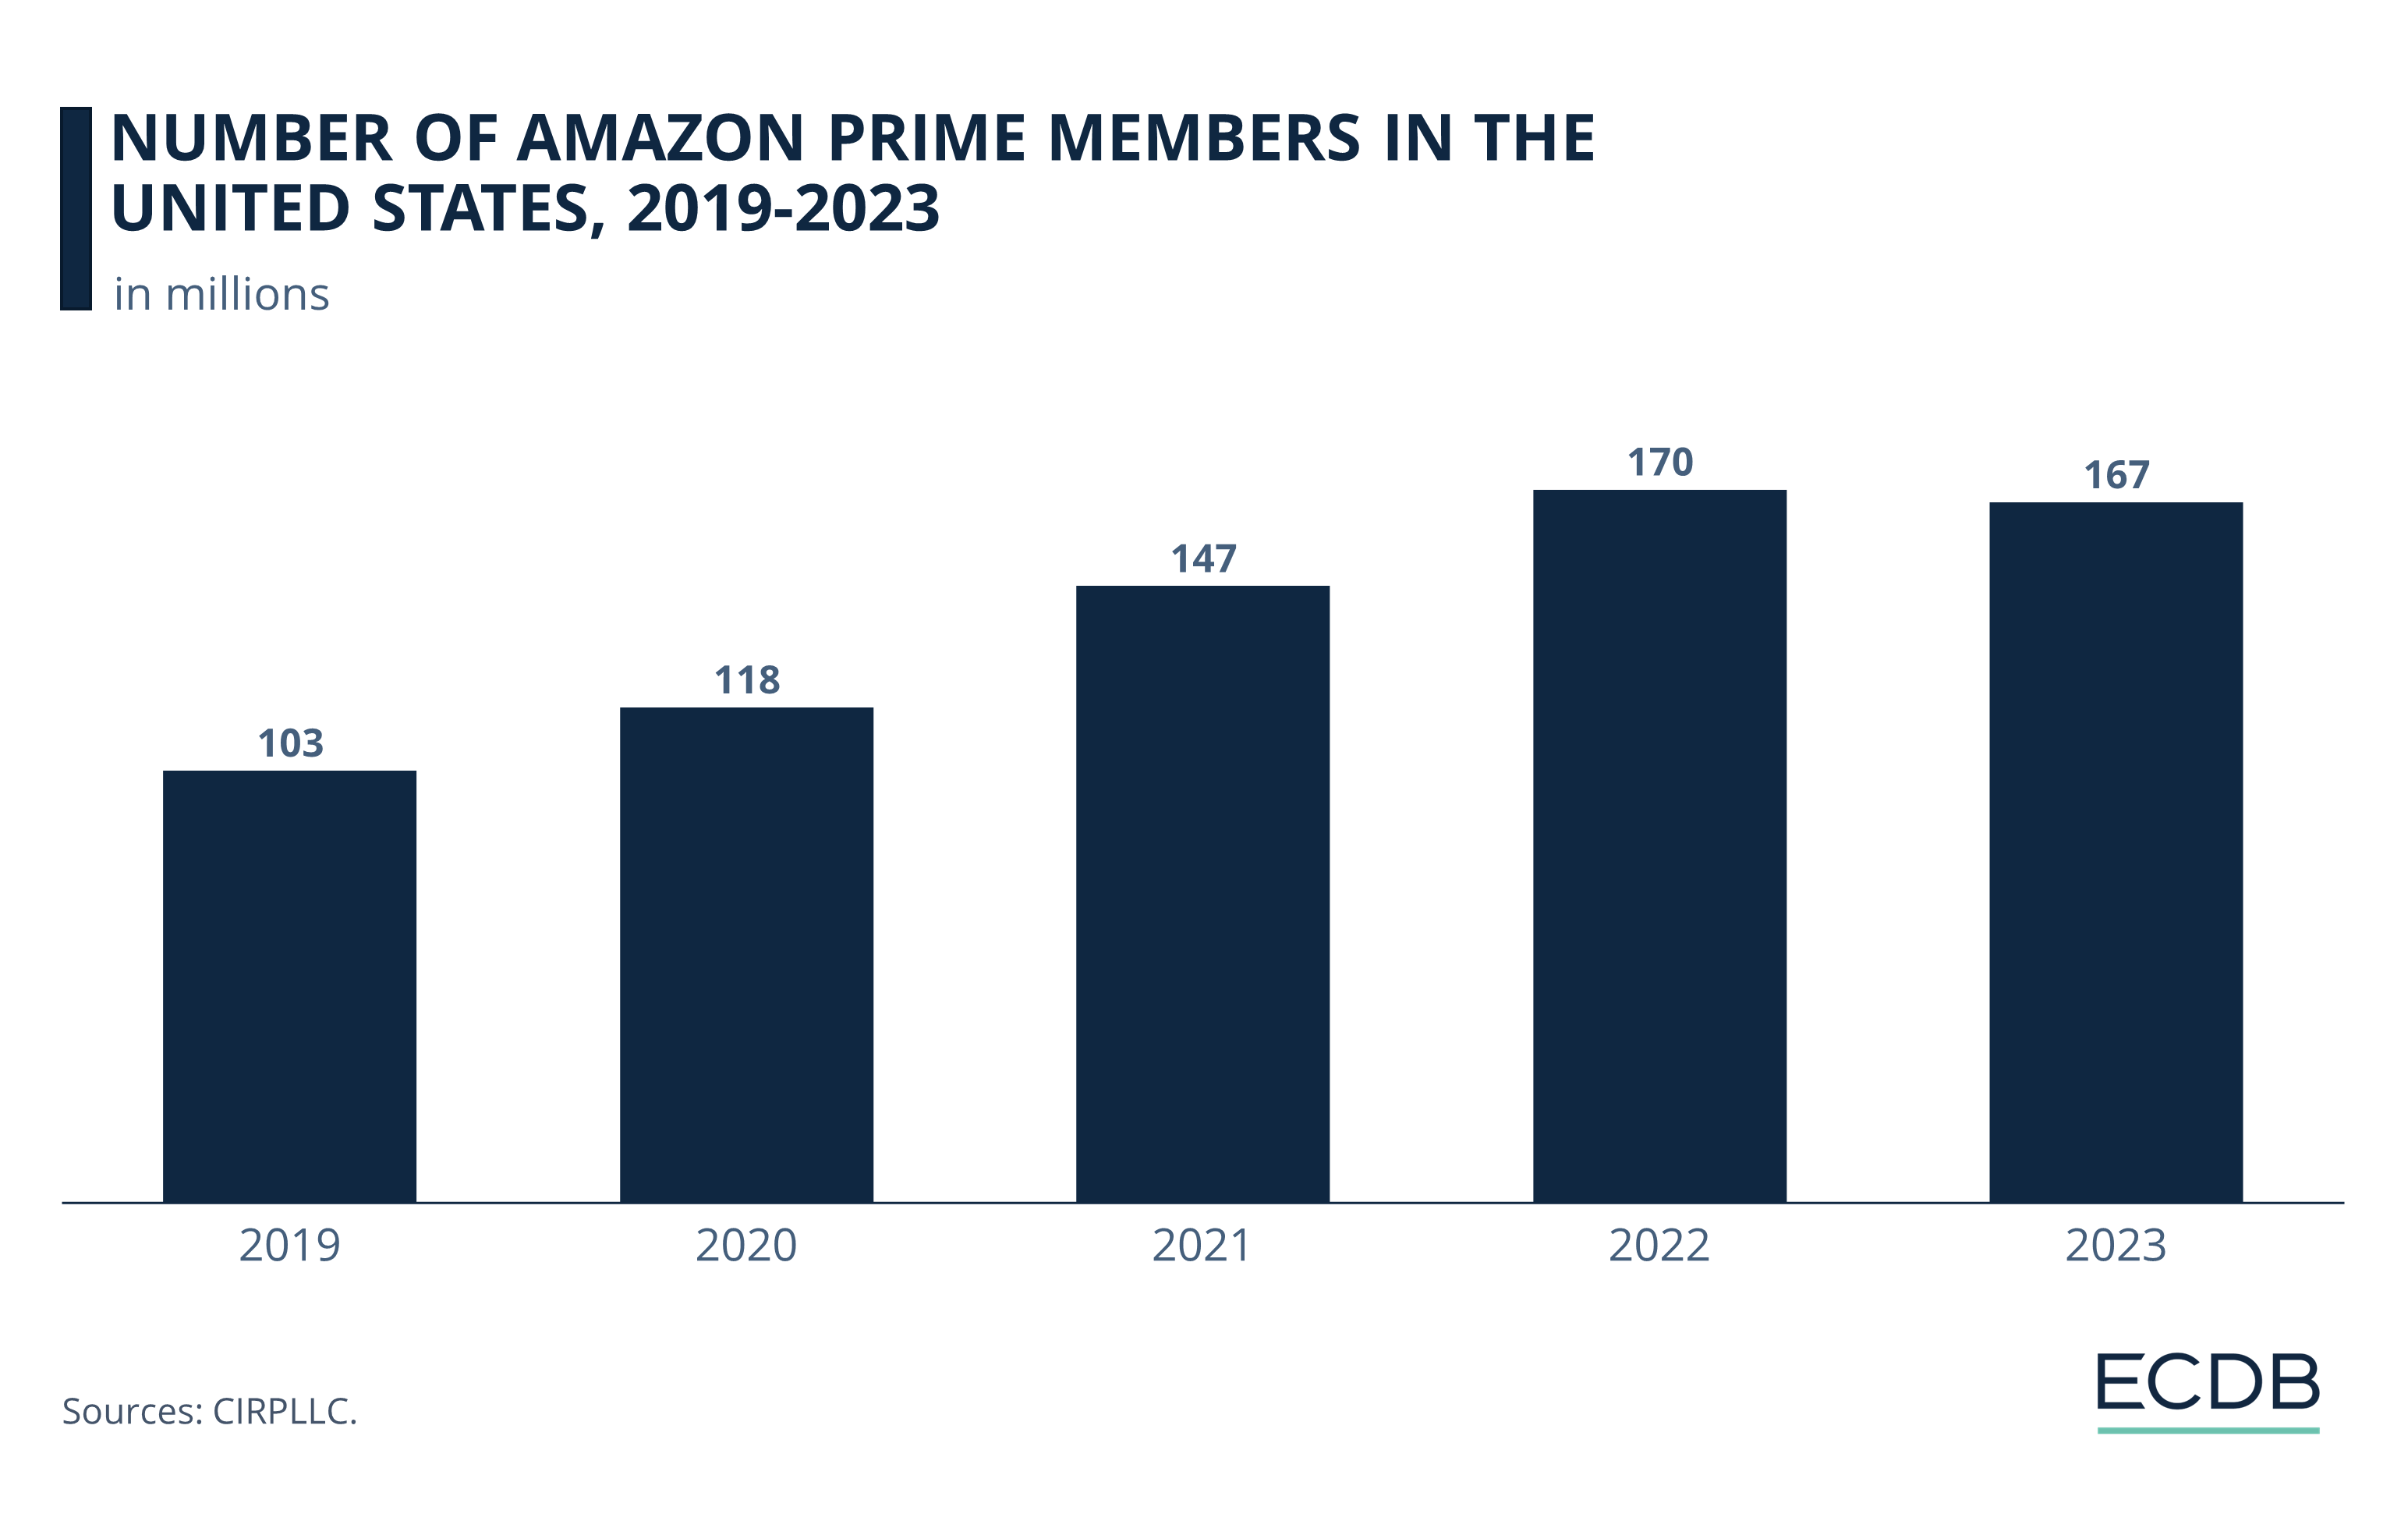
The number of Amazon Prime members in the United States saw a temporary spike in 2022, when 170 million subscribers used the service. This was a 61% increase from 2019, when 103 million Prime members were recorded.
However, there was a slight drop in user numbers in 2023. While Prime memberships only declined by a small margin, and Amazon disputed the downward trend noted by CIRP, the retail giant was unable to provide evidence to the contrary. Analysts have suggested that recent increases in Prime membership fees may have contributed to the decline in membership.
Because of the wide range of services included in its Prime membership program, Amazon has many competitors where consumers may feel they are getting a better deal. One of the key features of a Prime subscription is exclusive access to its own video and music streaming platforms.
Growing Budget for Prime Streaming Content
Competing with the likes of Netflix, Disney+, HBO, Hulu and others, Amazon Prime is not only a streaming platform, but also produces its own content based on audience feedback. In 2021, Amazon acquired film studio MGM, expanding its exclusive rights to a larger pool of titles.
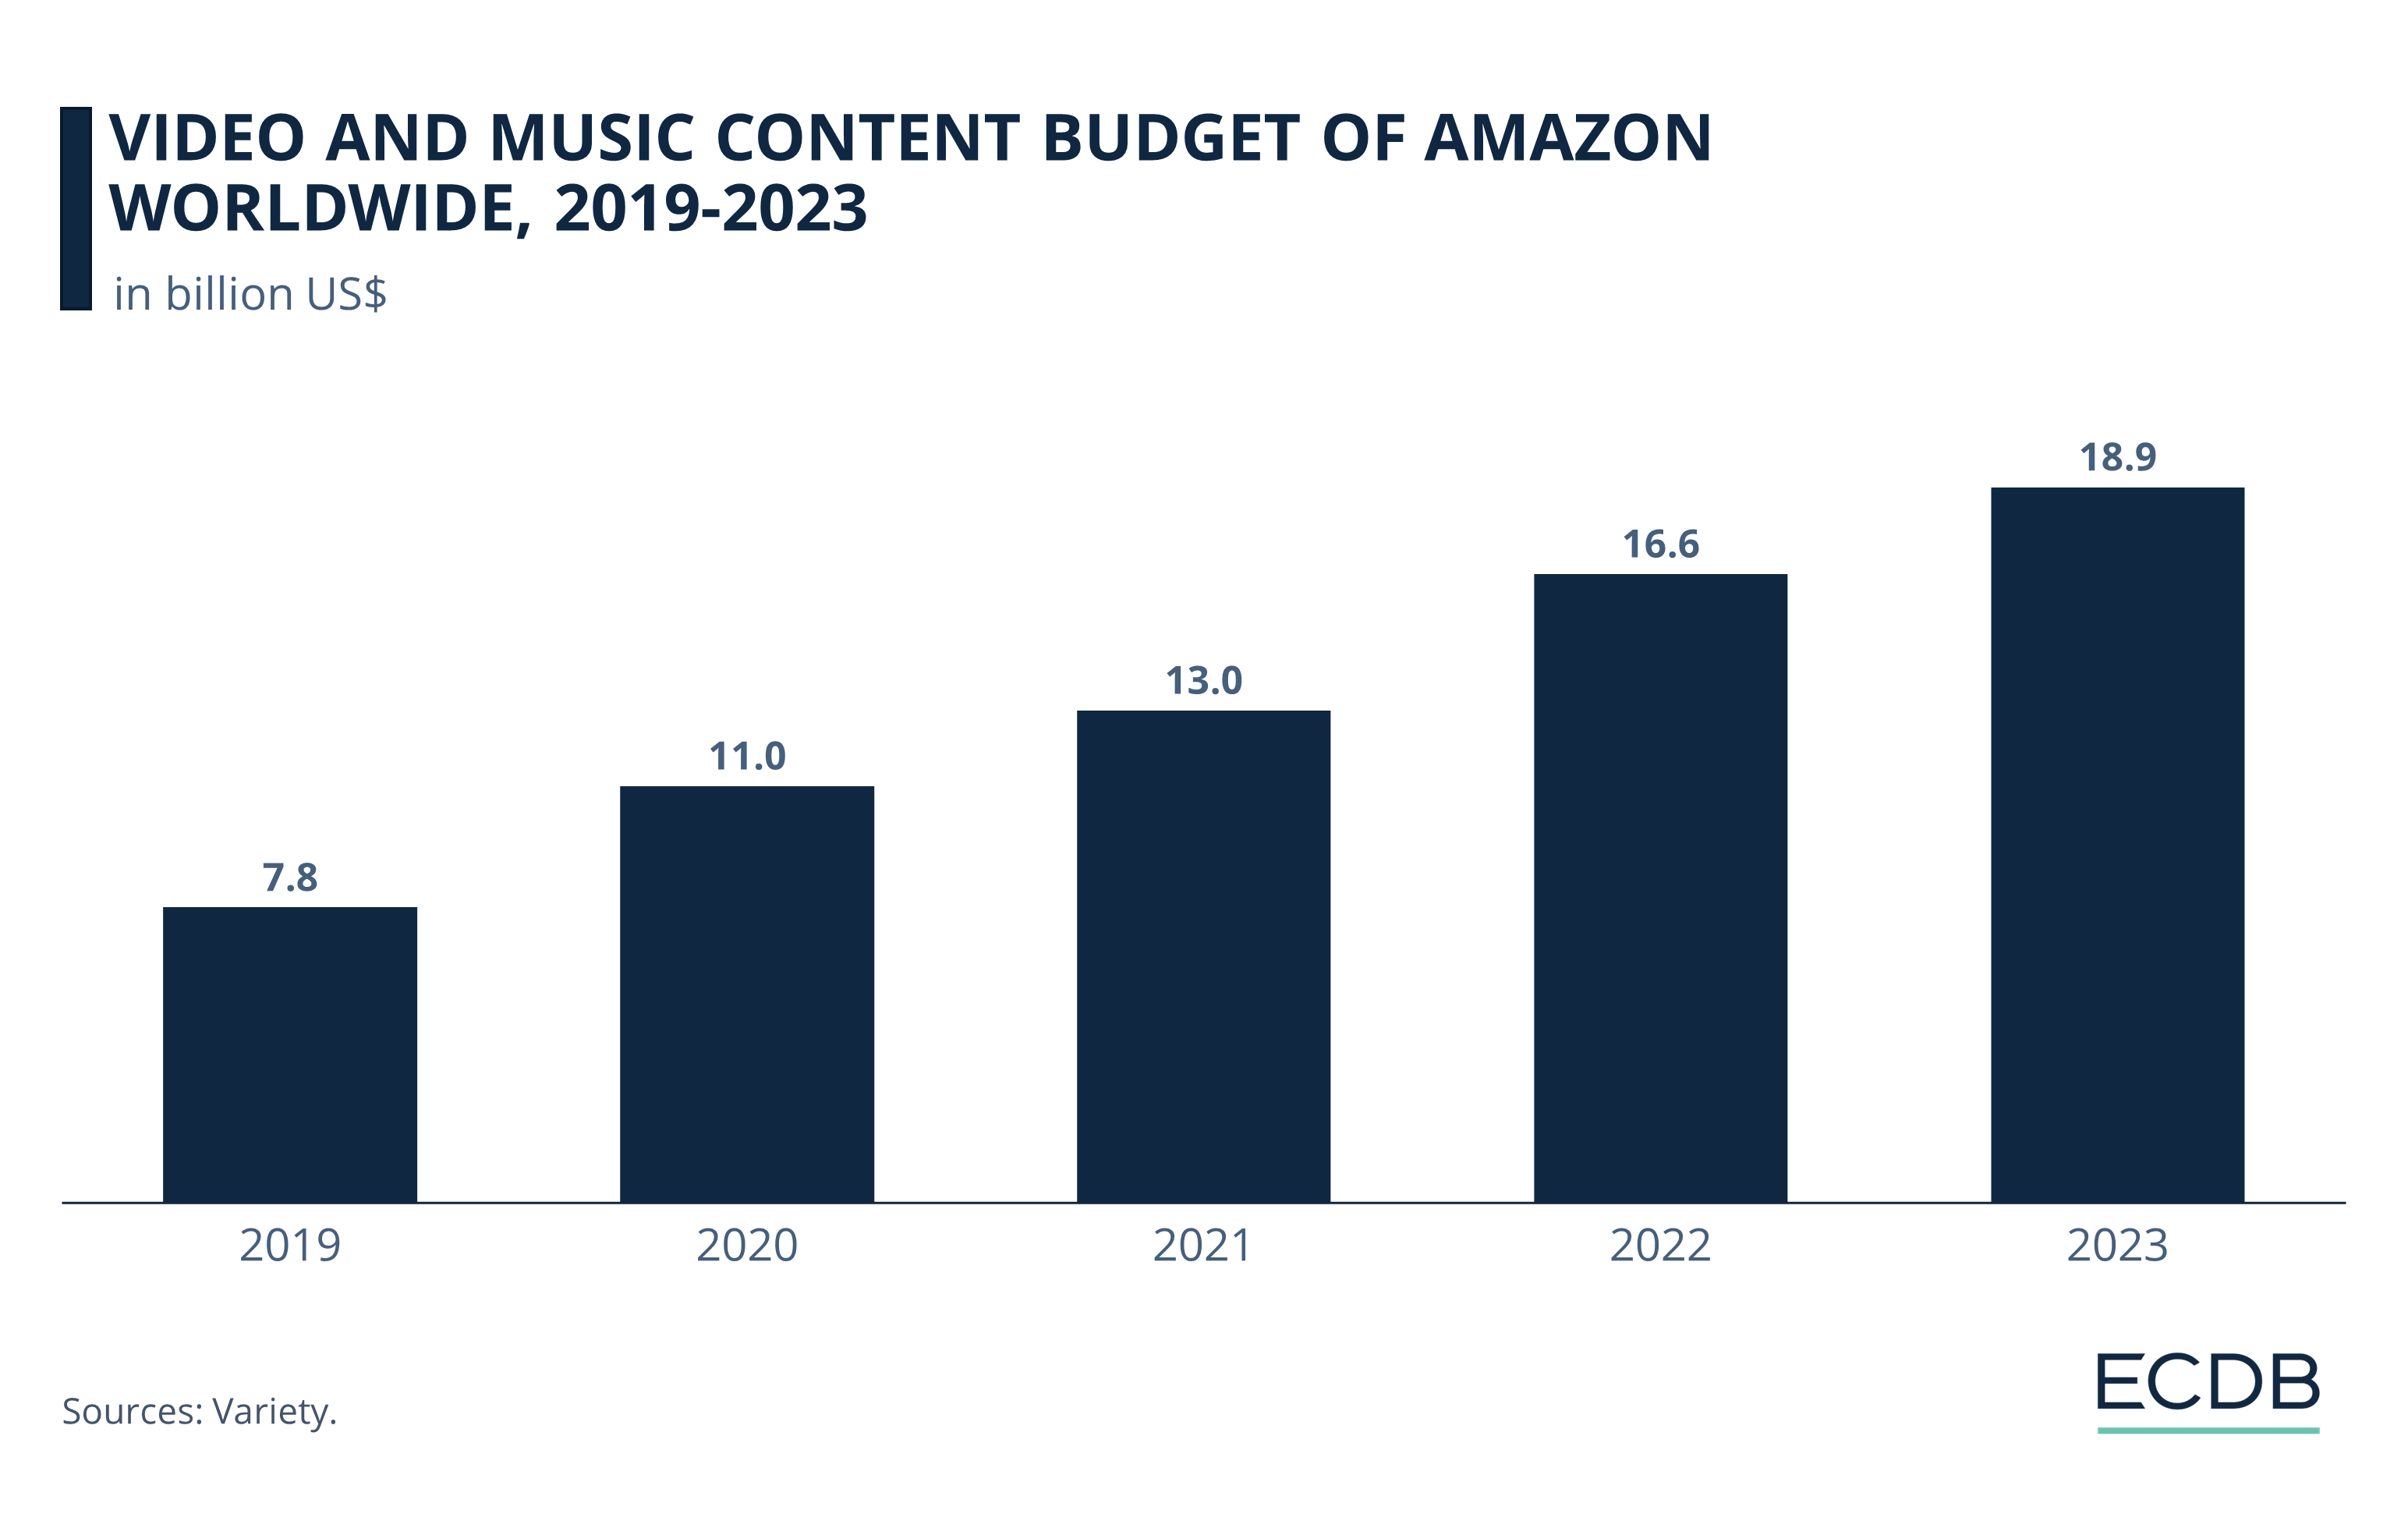
Together with Amazon Music, a growing budget is available for the streaming content accessible to Prime users, reaching US$18.9 billion in 2023. This is made possible in part by the massive acquisitions Amazon has made over the years.
Amazon Subsidiary Zappo’s Sold Nearly US$1 Billion Online in 2022
The various subsidiaries and associated external domains should not be underestimated in their contribution to Amazon’s online store revenues.
Note that these top 10 domains are among over 100 subsidiaries that Amazon has acquired over the years. Many are second-tier subsidiaries, meaning that a daughter company of Amazon acquired them, making Amazon the ”grandparent company”. There are also third-tier subsidiaries that were acquired by second-tier subsidiaries.
Amazon: Top External Domains by Online Net Sales
Note that this refers to online sales of physical products only, and therefore excludes Amazon subsidiaries such as Audible, Twitch or Goodreads, which fall out of the scope of ECDB's definition of eCommerce.
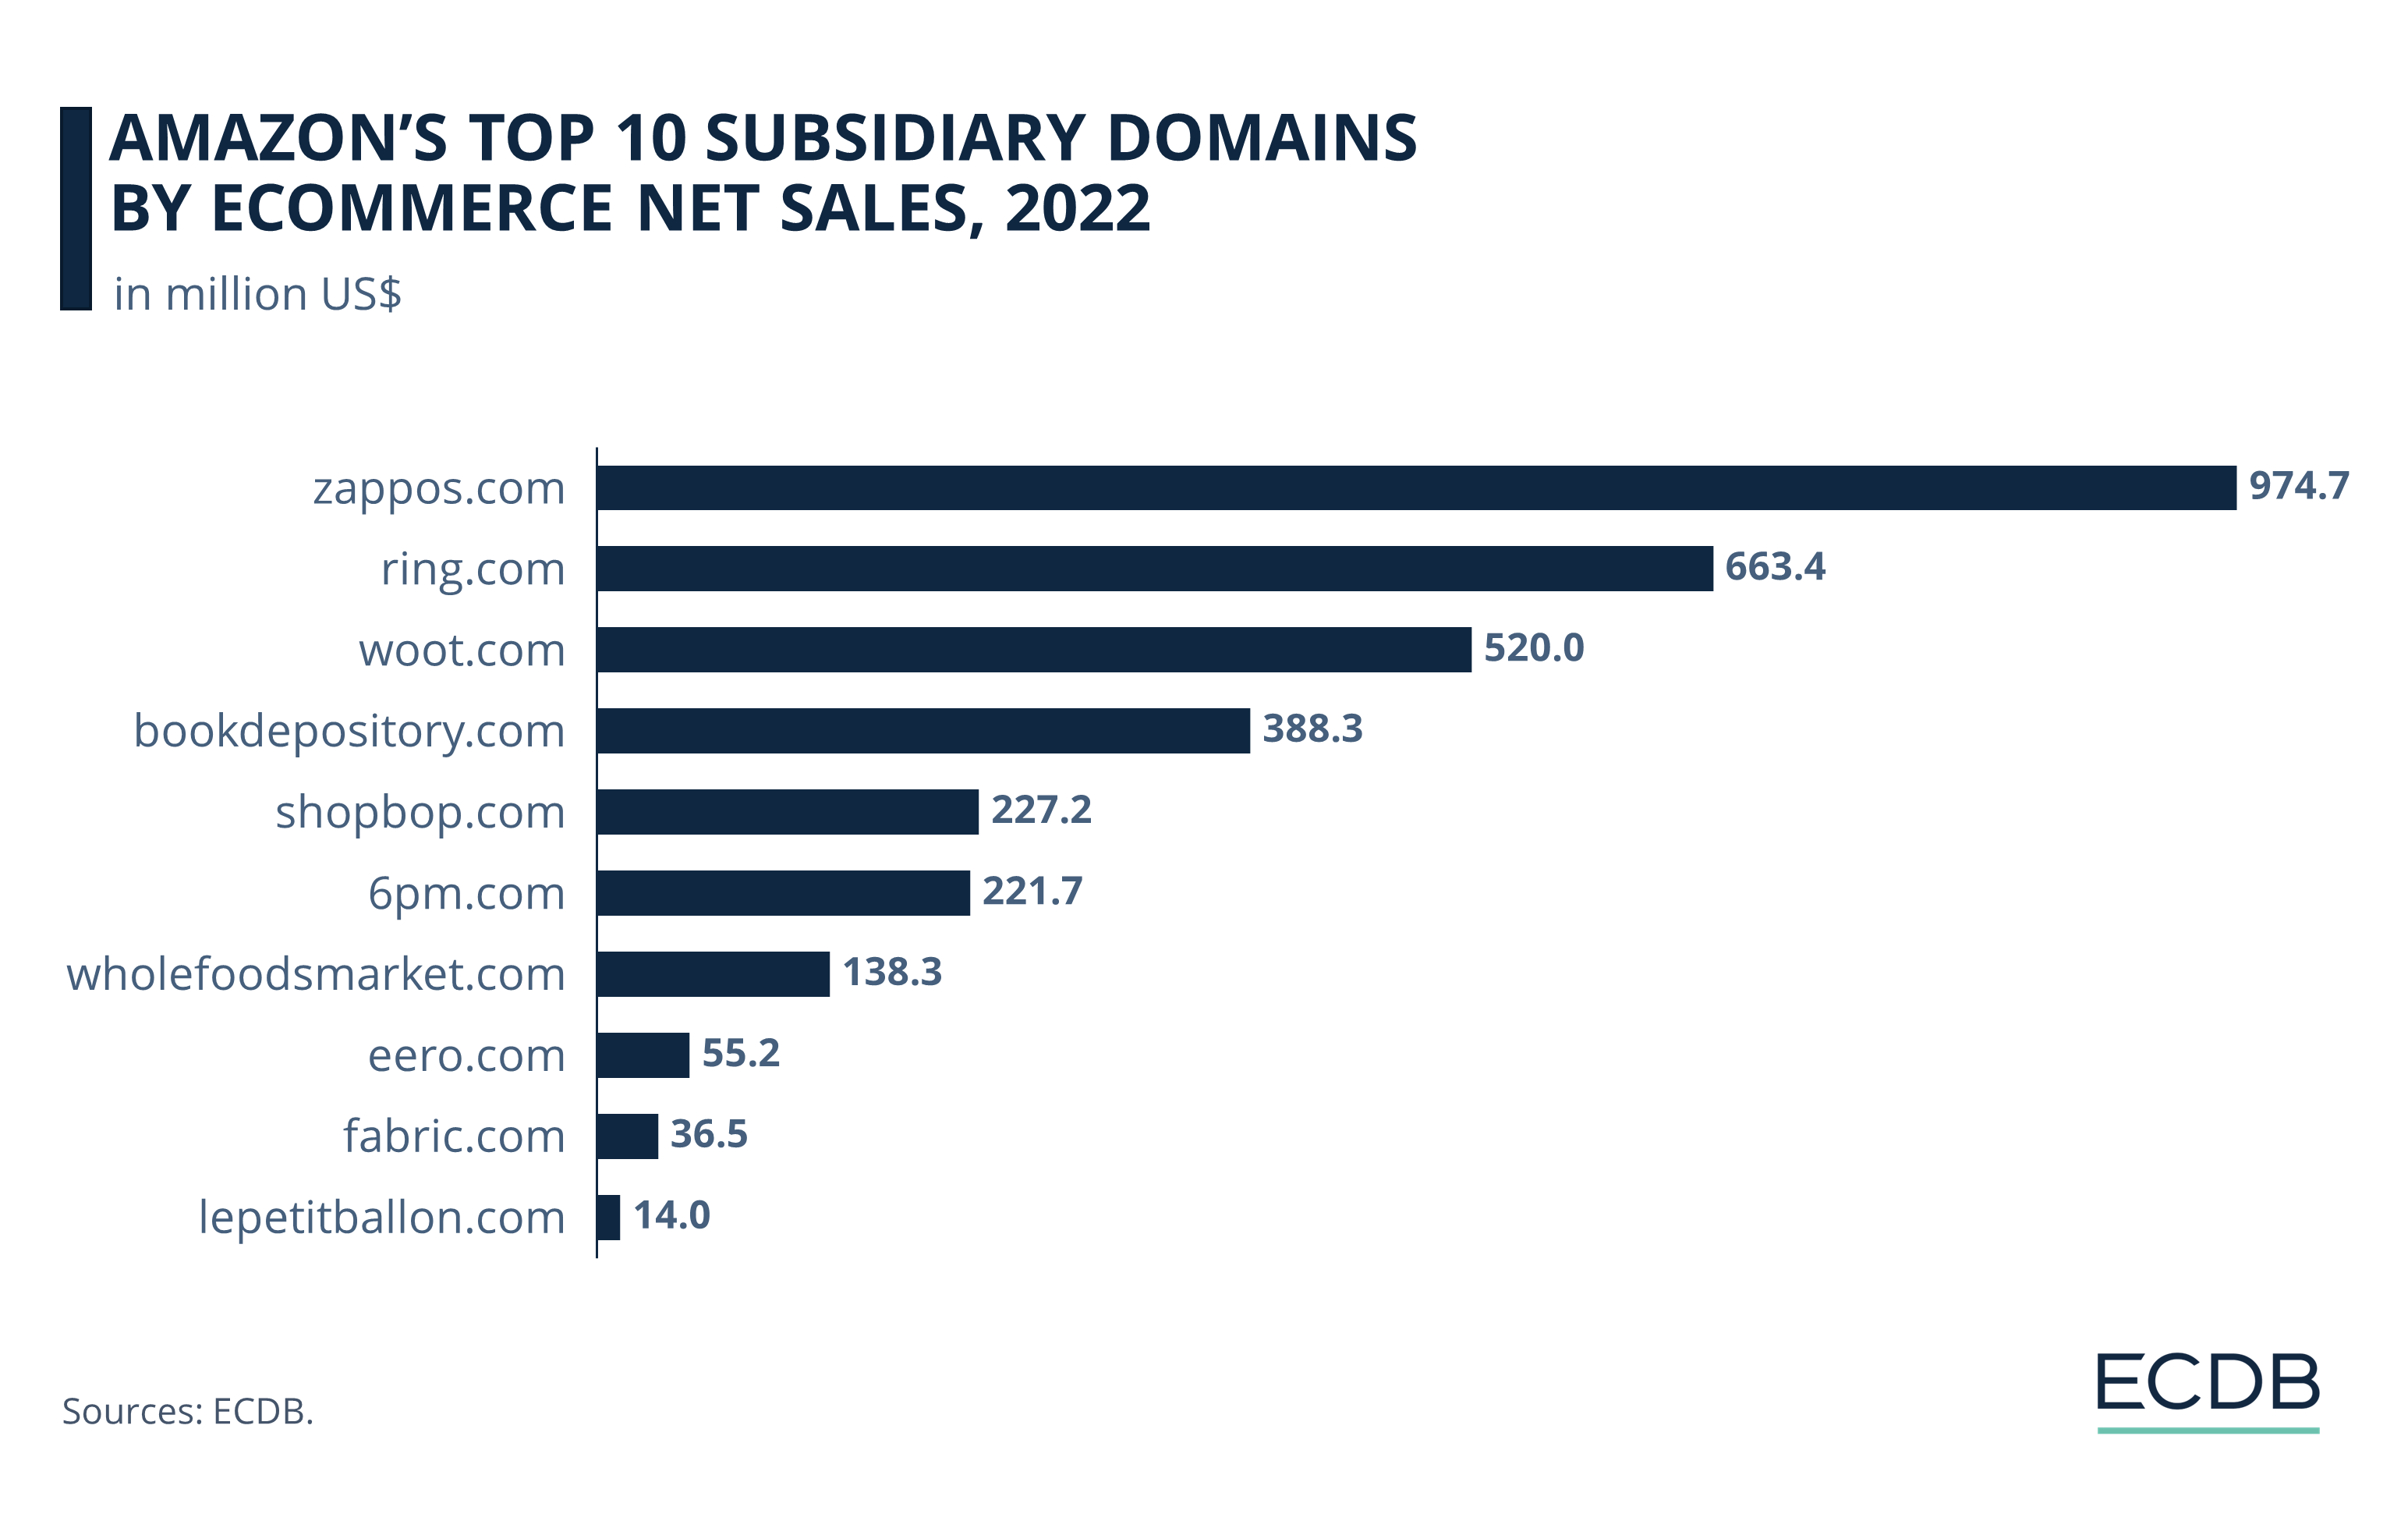
By far the most lucrative external domain in terms of eCommerce net sales is zappos.com, the online shoe store that Amazon bought in 2009. The shoe store, which approached the billion-dollar mark with online net sales of US$974.7 million in 2022, is part of Amazon's portfolio of success.
Ring.com, a smart home technology retailer, is Amazon’s second most successful third-party domain, with online revenues of US$663.4 million. Third rank is woot.com, a retailer with a diverse product assortment consisting of electronics, home goods, and apparel, with US$520 million in 2022.
Bookdepository.com ranks fourth with online net sales of US$388.3 million in 2022, but the store was closed in 2023 amid a wave of closures involving Amazon’s devices and books segments, as well as some of Amazon’s physical stores, including its Amazon Style locations. In fifth place is shopbop.com, a high-end clothing and beauty products brand, which generated US$227.2 million in 2022.
Close behind in sixth place is 6pm.com, a second-tier subsidiary acquired by Zappos.com, LLC that operates as an online marketplace for discount retailers. 6pm.com made US$221.7 million in online net sales in 2022. Further down the list is organic foods retailer Whole Foods Market, an established grocer with an extensive brick-and-mortar presence that was acquired by Amazon in 2017. In 2022, wholefoodsmarket.com generated US$138.3 million.
The remaining three rankings are eero.com (US$55.2 million), fabric.com (US$36.5 million), and lepetitballon.com (US$14 million). Eero sells easy-to-use WiFi routers, Fabric sold apparel fabrics but was discontinued in 2022, and Le Petit Ballon is a French wine store that connects customers with wine sellers over the internet.
Most Products on Amazon Come From China
Jungle Scout conducted a survey of Amazon sellers and brands to examine their relationship with Amazon. One of the areas of inquiry was the origin of the products that sellers offer on Amazon.
Brands can source their products from multiple countries, which is why the values in the chart exceed 100%.
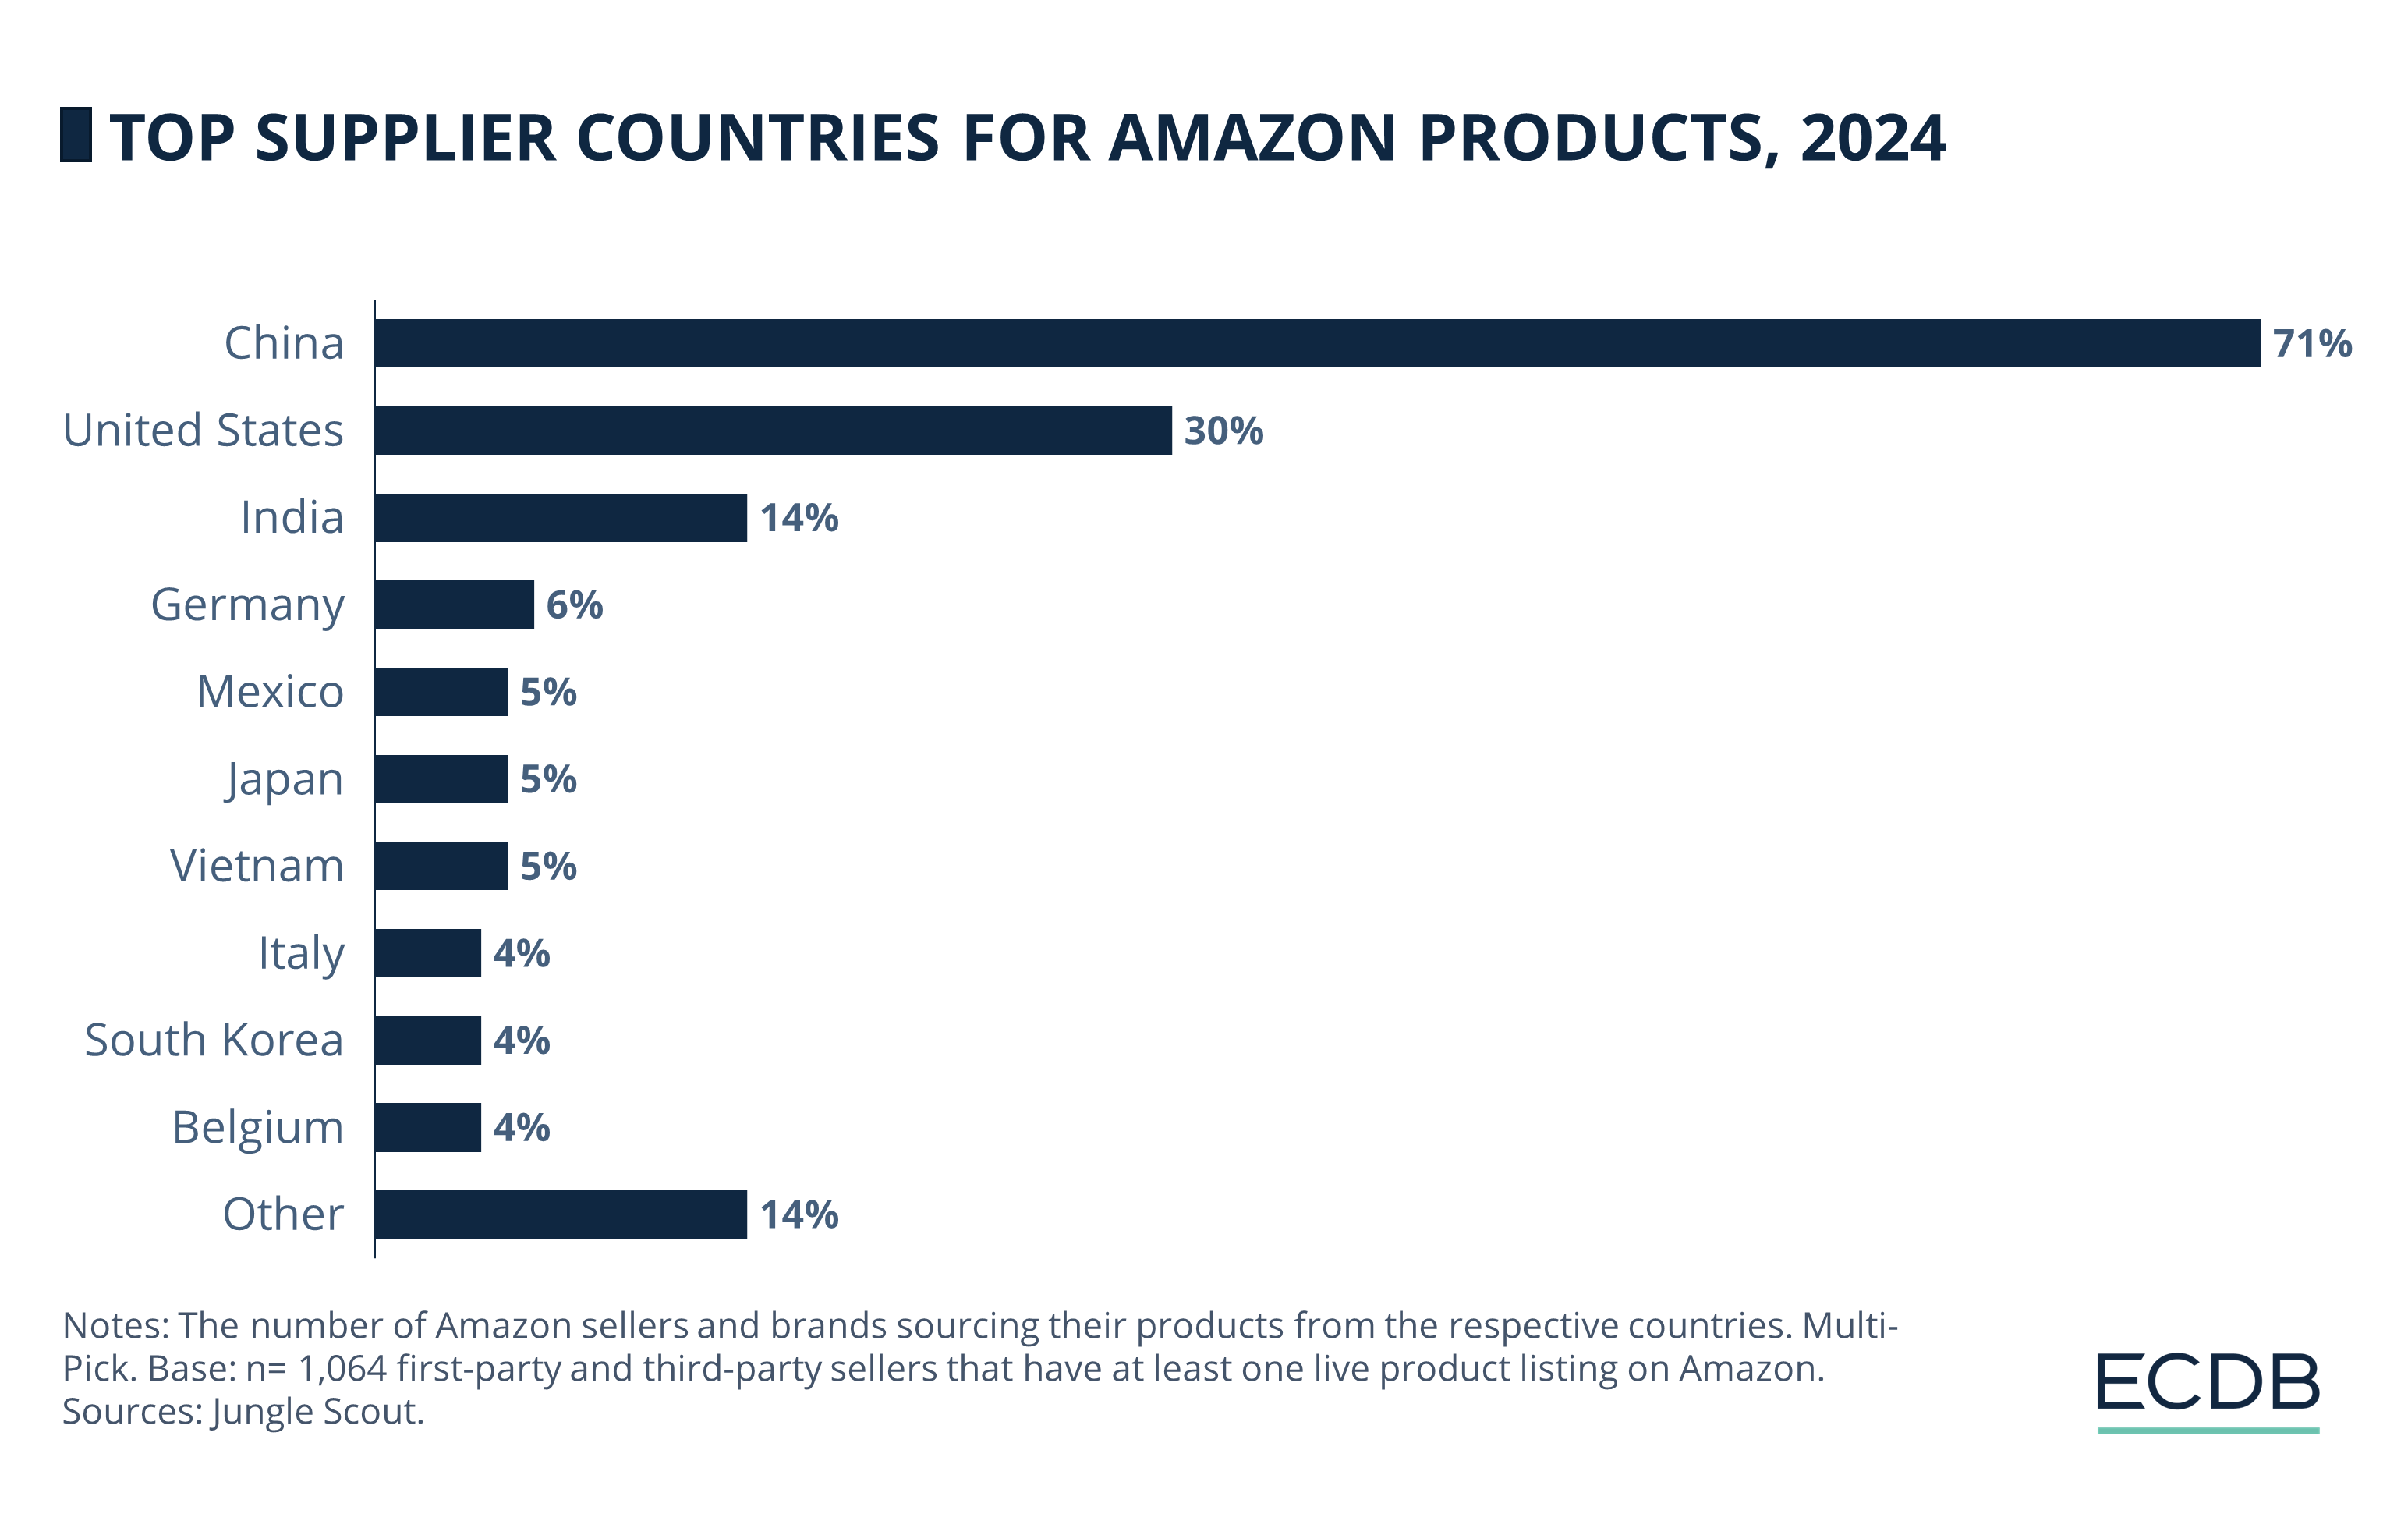
China is by far the most common country of origin for products sold on Amazon, cited by 71% of sellers and brands. Further behind is the United States, mentioned by 30% of Amazon sellers and brands. India is the next country that stands out, with a 14% share.
Rankings 4-10 indicate mostly similar shares, starting with Germany at 6%, through Mexico, Japan, and Vietnam at 5%, and ending with Italy, South Korea, and Belgium at 4%. Other countries account for 14% of sellers and brands selling on Amazon.
Amazon’s broad reach and established position as a retailer and shipping provider are persuading brands of all kinds to sell their products on the platform. But how much significance does Amazon have for its affiliate sellers?
Amazon Is Mostly Used by Sellers as an Additional Retail Channel
The reasons for selling products on Amazon as a third-party or first-party retailer are varied, ranging from using Amazon as an additional channel to selling products on Amazon as a main business.
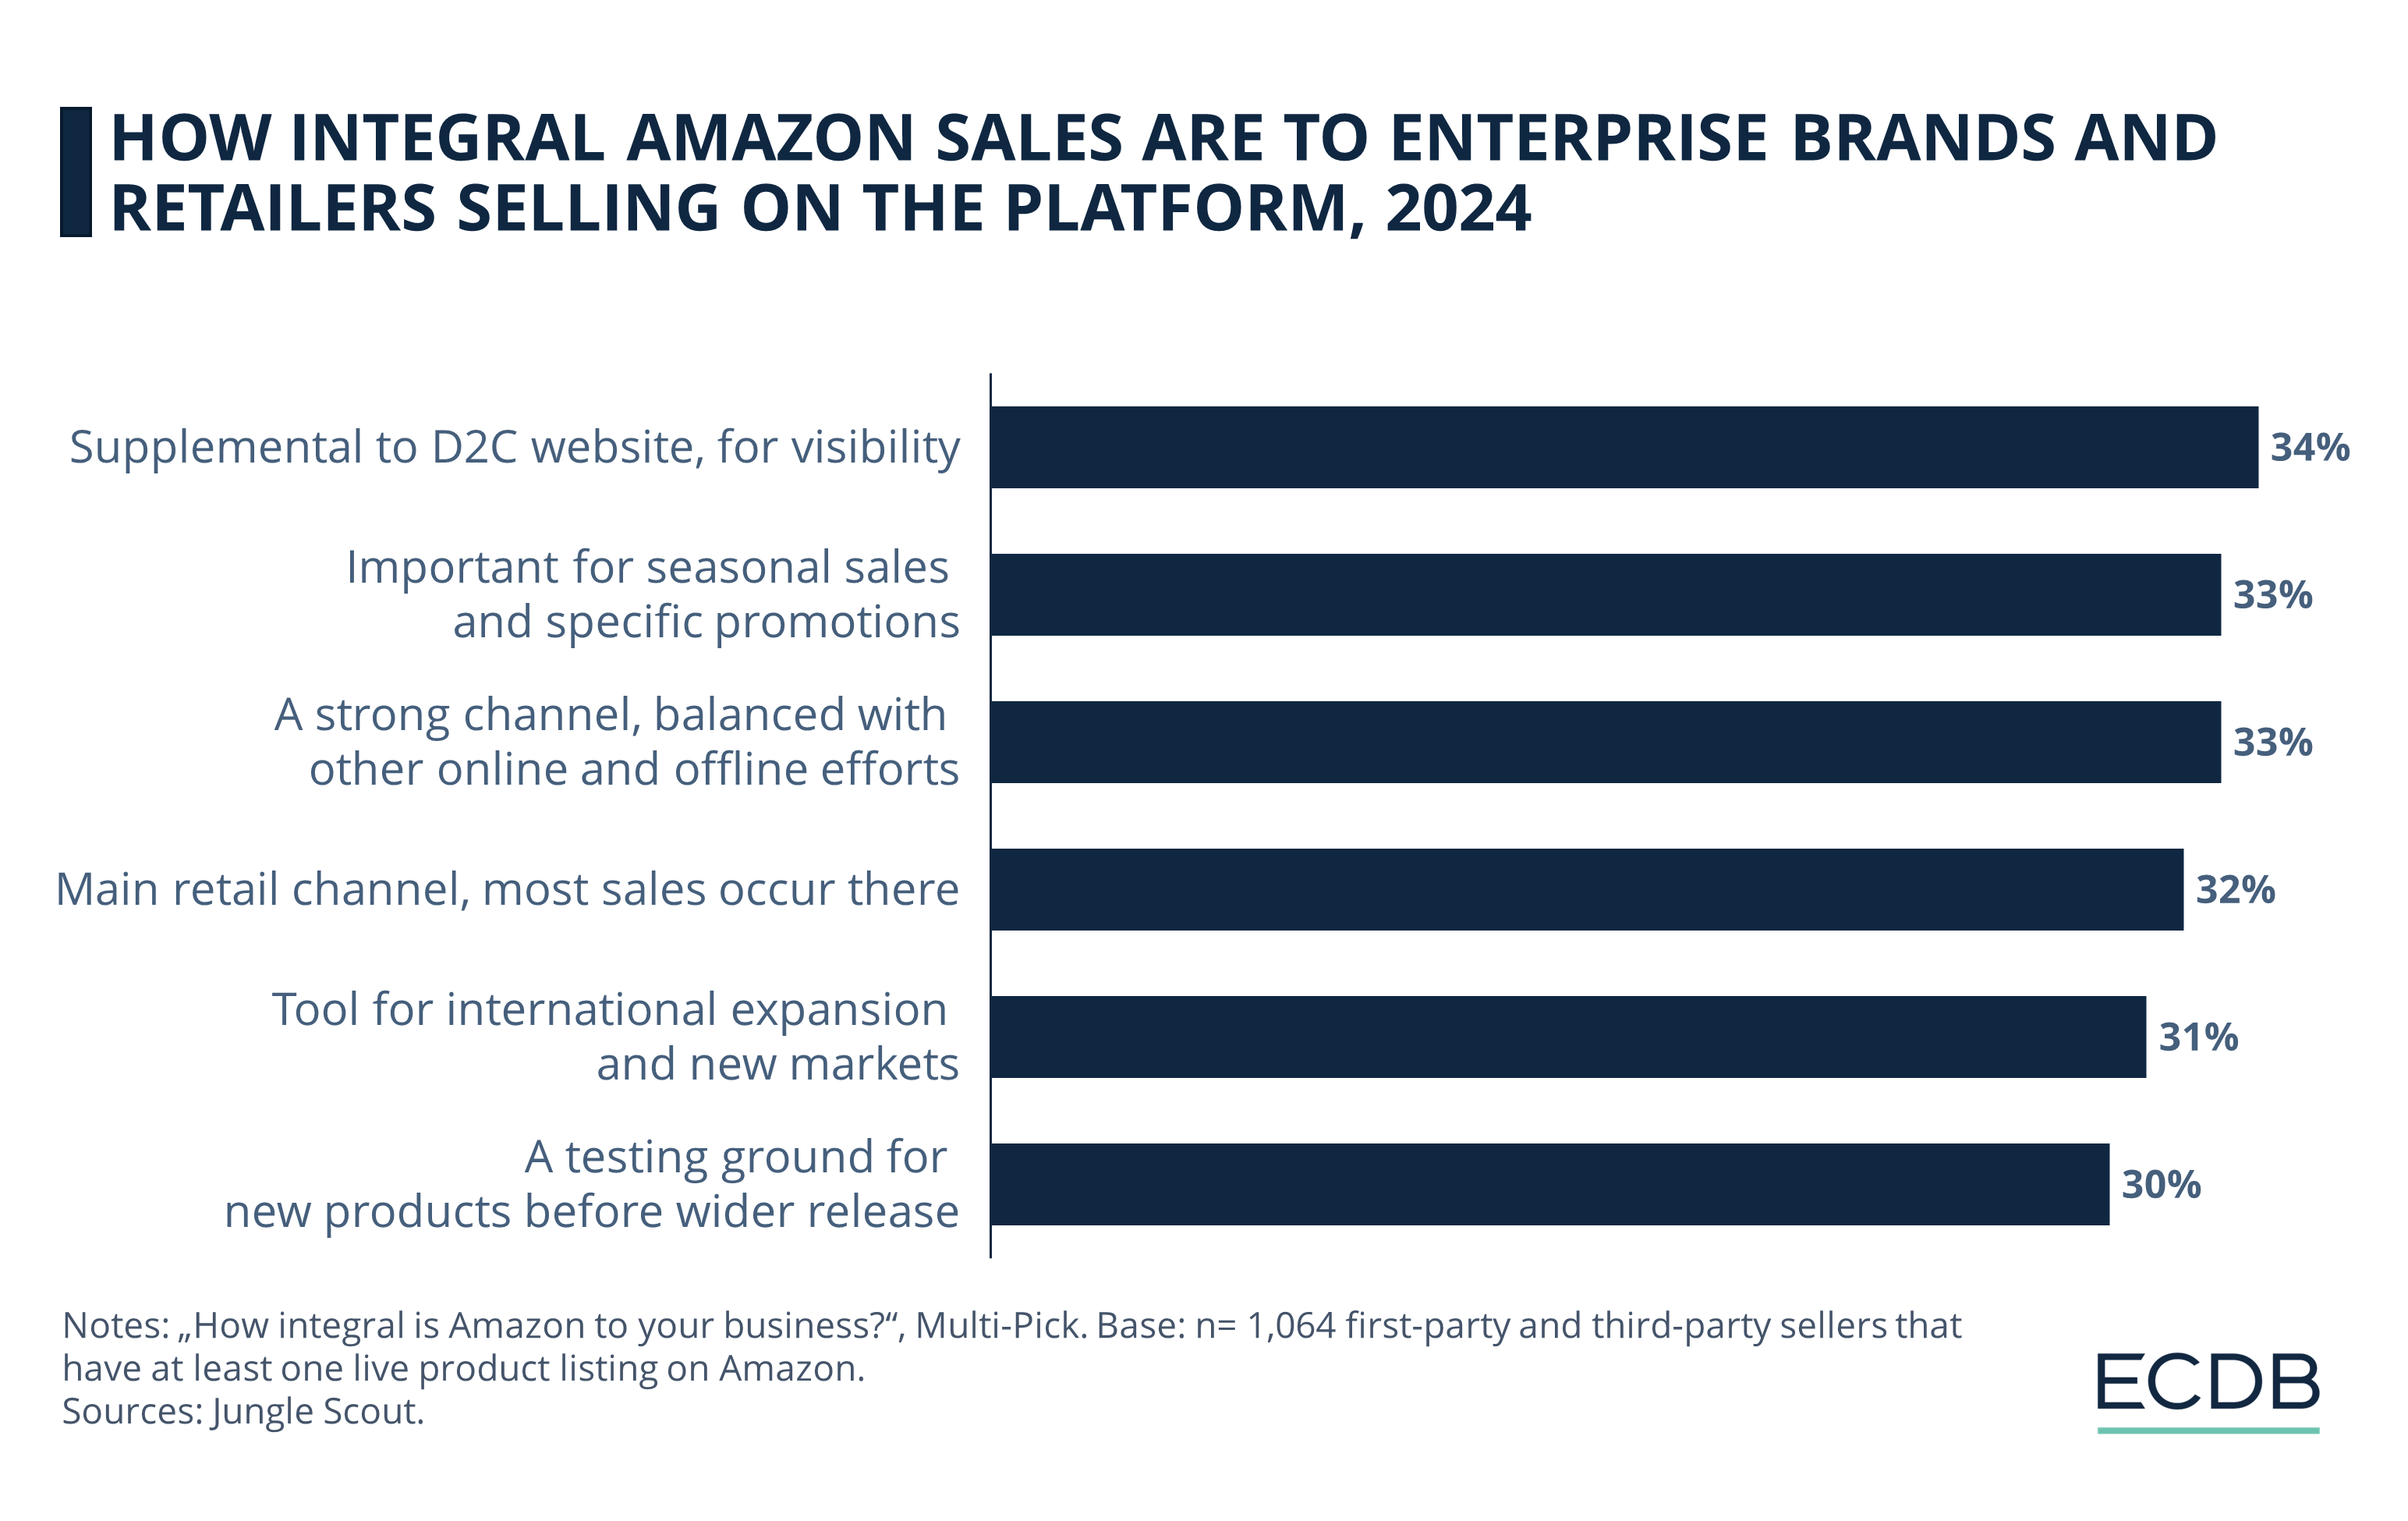
Responses regarding the importance of Amazon product listings to sellers' overall business are evenly distributed in terms of frequency. At the top of the list, with 34% of sellers and brands agreeing, is selling on Amazon as an adjunct to an established D2C site.
Almost as many respondents, 33%, say their Amazon sales are used for seasonal or promotional distribution of their products, while another 33% say Amazon is a strong channel used in conjunction with other online or offline ventures.
In third place are 32% of brands and sellers who consider Amazon their primary sales channel. This is followed by 31% who use Amazon as a tool for international expansion and new markets, while 30% test sell products on the platform to gauge product popularity before a wider release.
Business Size: Large Sellers Use More Diverse Advertising Methods
Amazon distinguishes between two types of sellers based on company size: Amazon Sellers & SMB (Small to Medium-Sized Businesses), which are either individual entrepreneurs or small businesses, and Enterprise Brands & Retailers, which are larger corporations or conglomerates.
Both these types of sellers can sell their products to Amazon as first-party sellers or third-party sellers. The first-party type sells merchandise directly to Amazon, which Amazon offers to customers as its own brand and earns revenue as a retailer. The third-party type sells products to customers through Amazon’s online marketplace, from which Amazon earns a commission as a marketplace provider.
The top channels through which Amazon businesses advertise their products are broken down by company size:
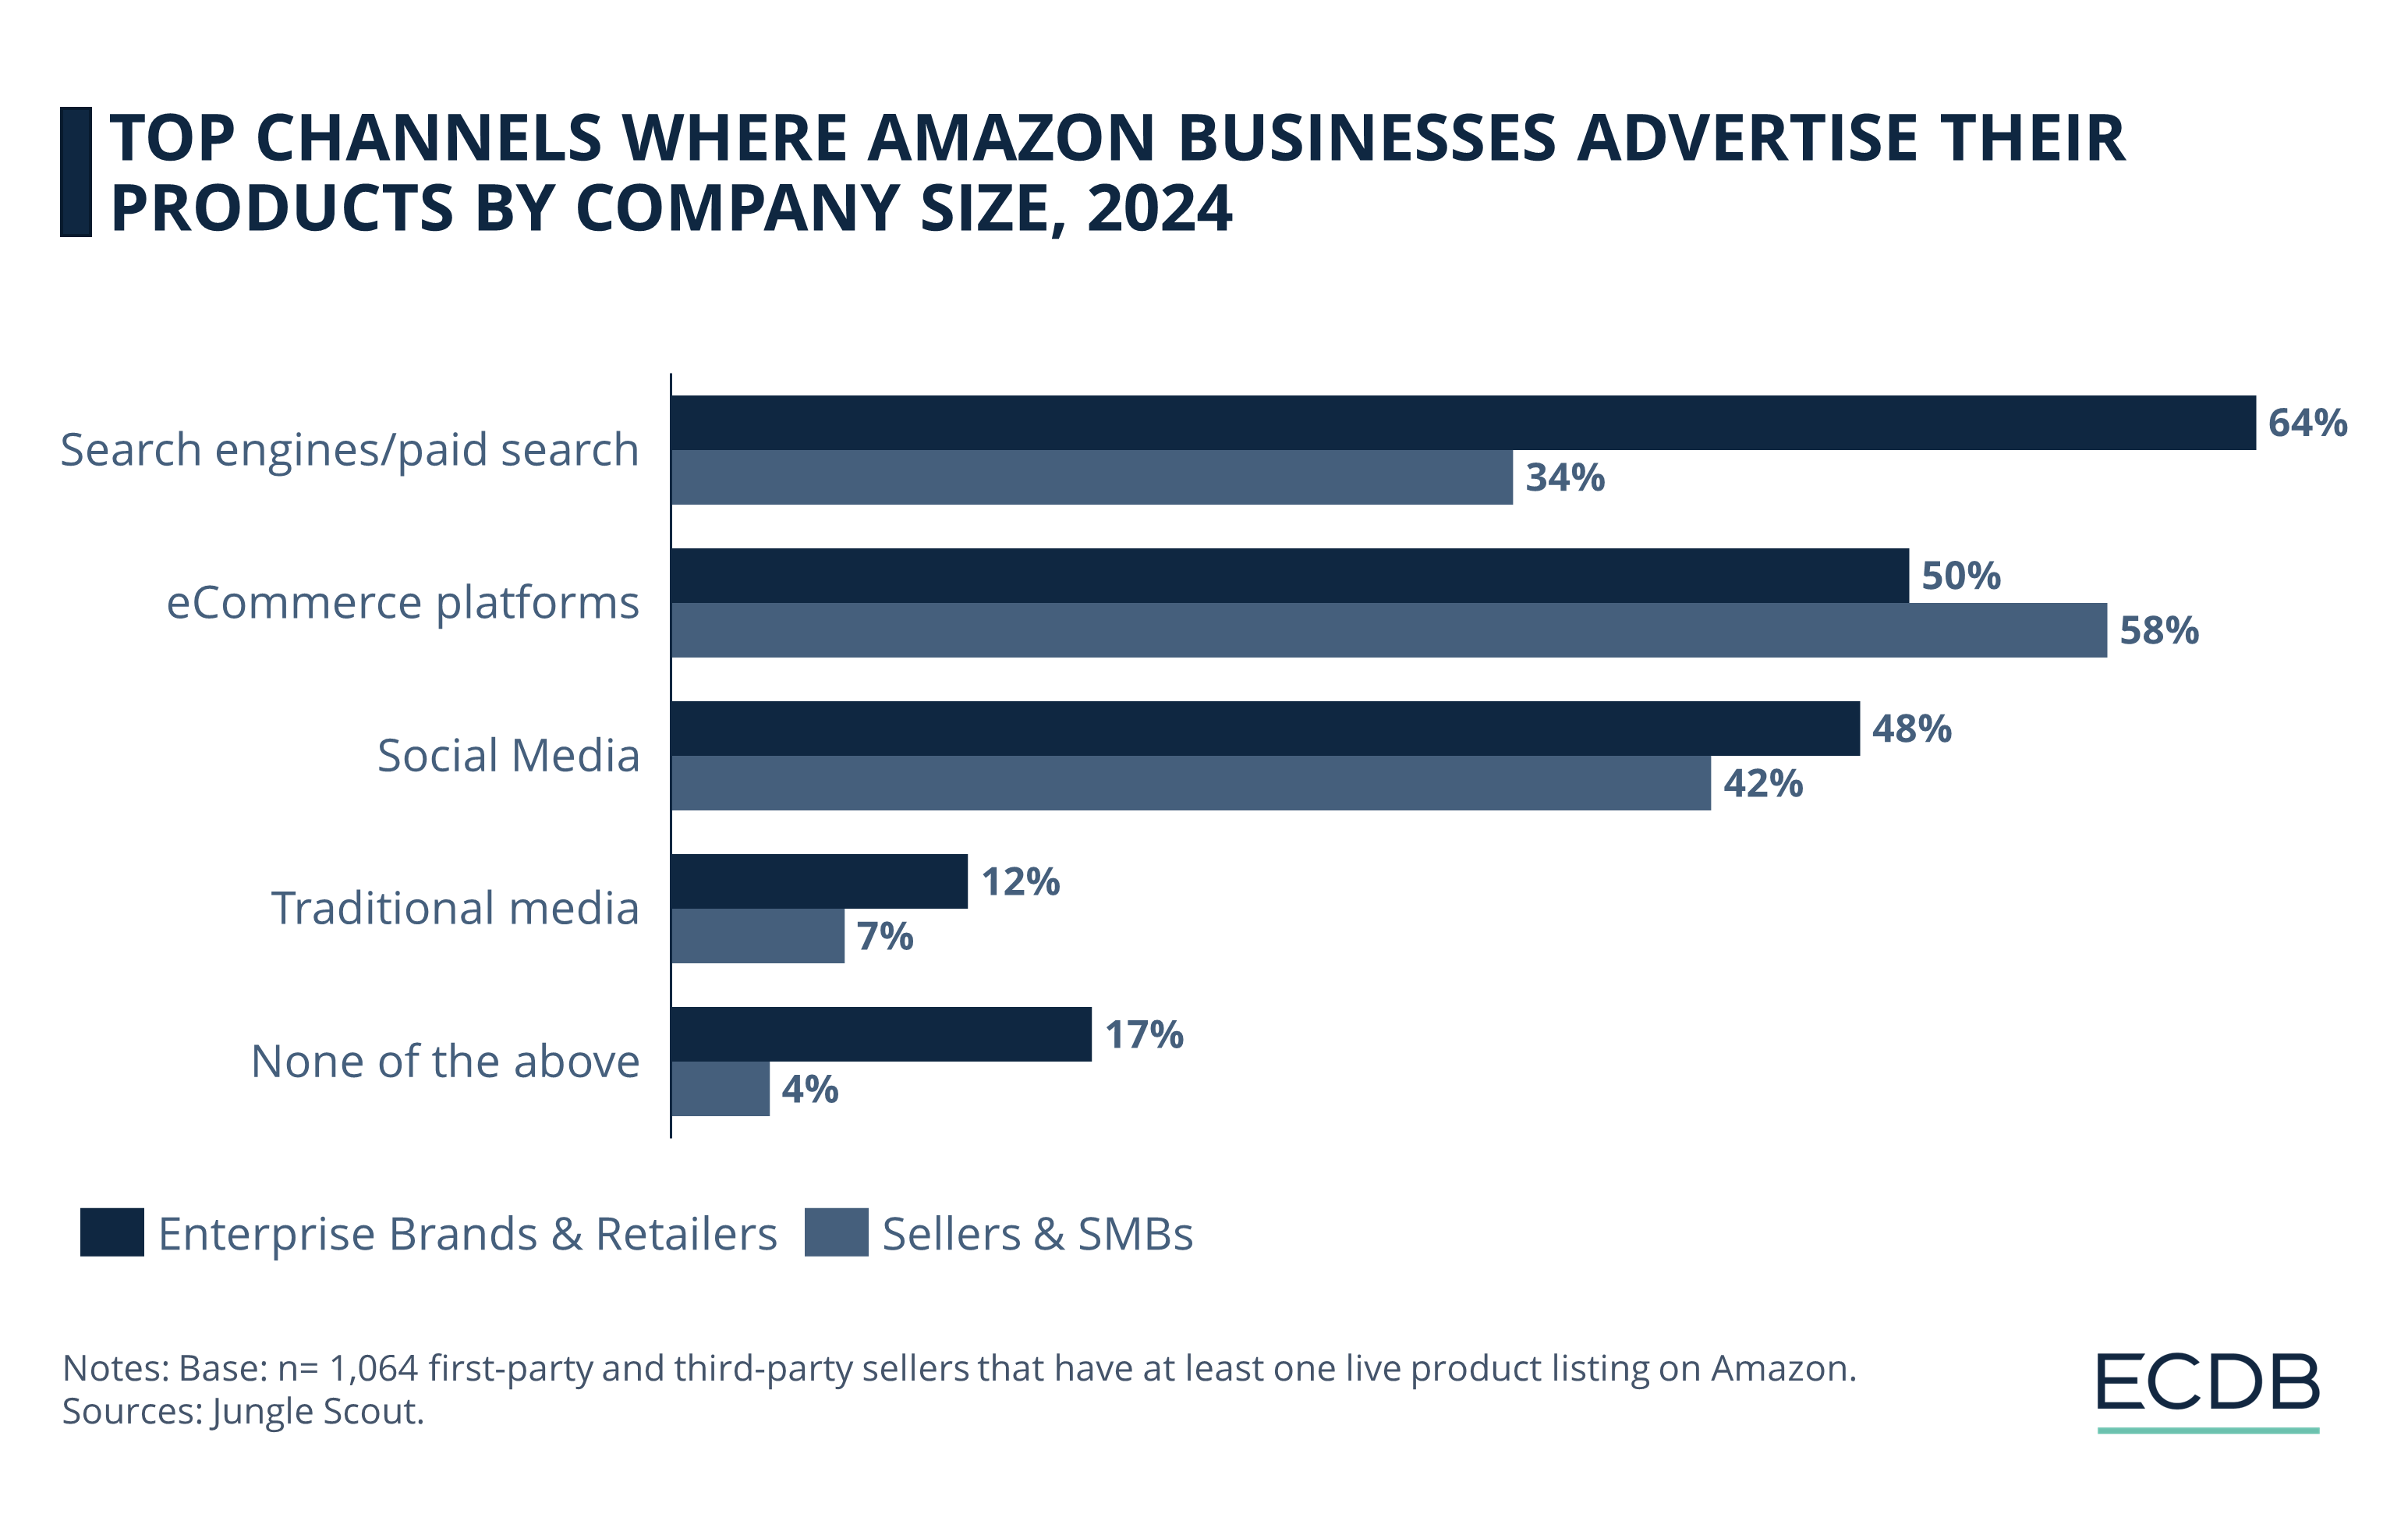
For larger businesses, i.e. Enterprise Brands & Retailers, the most common advertising channel is search engines or sponsored search results (64%), while this channel is about half as popular for smaller businesses (34%).
Small companies tend to promote their products on eCommerce sites (50%), similar to 58% of large companies. Retail media advertising is also a field in which Amazon has major stakes, contributing a portion of total revenues.
Advertising on social media is similarly used by both small and large businesses, with 48% of large businesses and 42% of small businesses agreeing.
While it is also more common for large companies to advertise in traditional media (12%), small businesses are less likely to do so (7%). However, larger companies are also the ones saying they do not use any of the above advertising methods, at 17%, compared to only 4% of small businesses.
![]()
Amazon Business Analysis: Closing Remarks
Amazon stays ahead of competitors due to its economies of scale, and many established businesses seek its reach and visibility. The associated domains, businesses, and external sellers emphasize the sheer magnitude of Amazon’s influence. These are similar to Alibaba’s diverse income sources, which help mitigate financial risks. While newer players try to replicate Amazon’s product diversity and low pricing approach, Amazon’s dominance remains unmatched due to its far-reaching network and industry recognition.
Sources: Craft Industry Alliance – Forbes – Jungle Scout – NIF – Tech Crunch – The Robin Report – Wired – 6pm
Related insights
Article
Amazon's Top Competitors in the UK: GMV, Product Categories & Annual Growth
Amazon's Top Competitors in the UK: GMV, Product Categories & Annual Growth
Article
Temu Continues to Grow in 2024: Outselling Shein, Wish & Alibaba
Temu Continues to Grow in 2024: Outselling Shein, Wish & Alibaba
Article
Amazon: Which Domains Grew the Fastest?
Amazon: Which Domains Grew the Fastest?
Article
Most Valuable Global eCommerce Companies 2024
Most Valuable Global eCommerce Companies 2024
Article
Online Consumer Electronics Market in the United States: Top Players & Market Development
Online Consumer Electronics Market in the United States: Top Players & Market Development
Back to main topics