Store ranking
Top eCommerce stores in the Australian Furniture & Homeware market
In 2024, the top five online stores in the Australian Furniture & Homeware market are ikea.com, templeandwebster.com.au, woolworths.com.au, amartfurniture.com.au, and harveynorman.com.au. ikea.com leads this market with revenues of US$299.8 million in 2024. Followed by templeandwebster.com.au with sales of US$267.2 million and then woolworths.com.au with sales of US$241.2 million. Together, the top three online stores account for a market share of 24.4% of the top 100 stores in the Australian Furniture & Homeware market. The ranking is based on the top stores by eCommerce net sales in this market in 2024. By using the filters provided below, the list of online stores can be narrowed down according to different types of research questions.
Advanced search filters
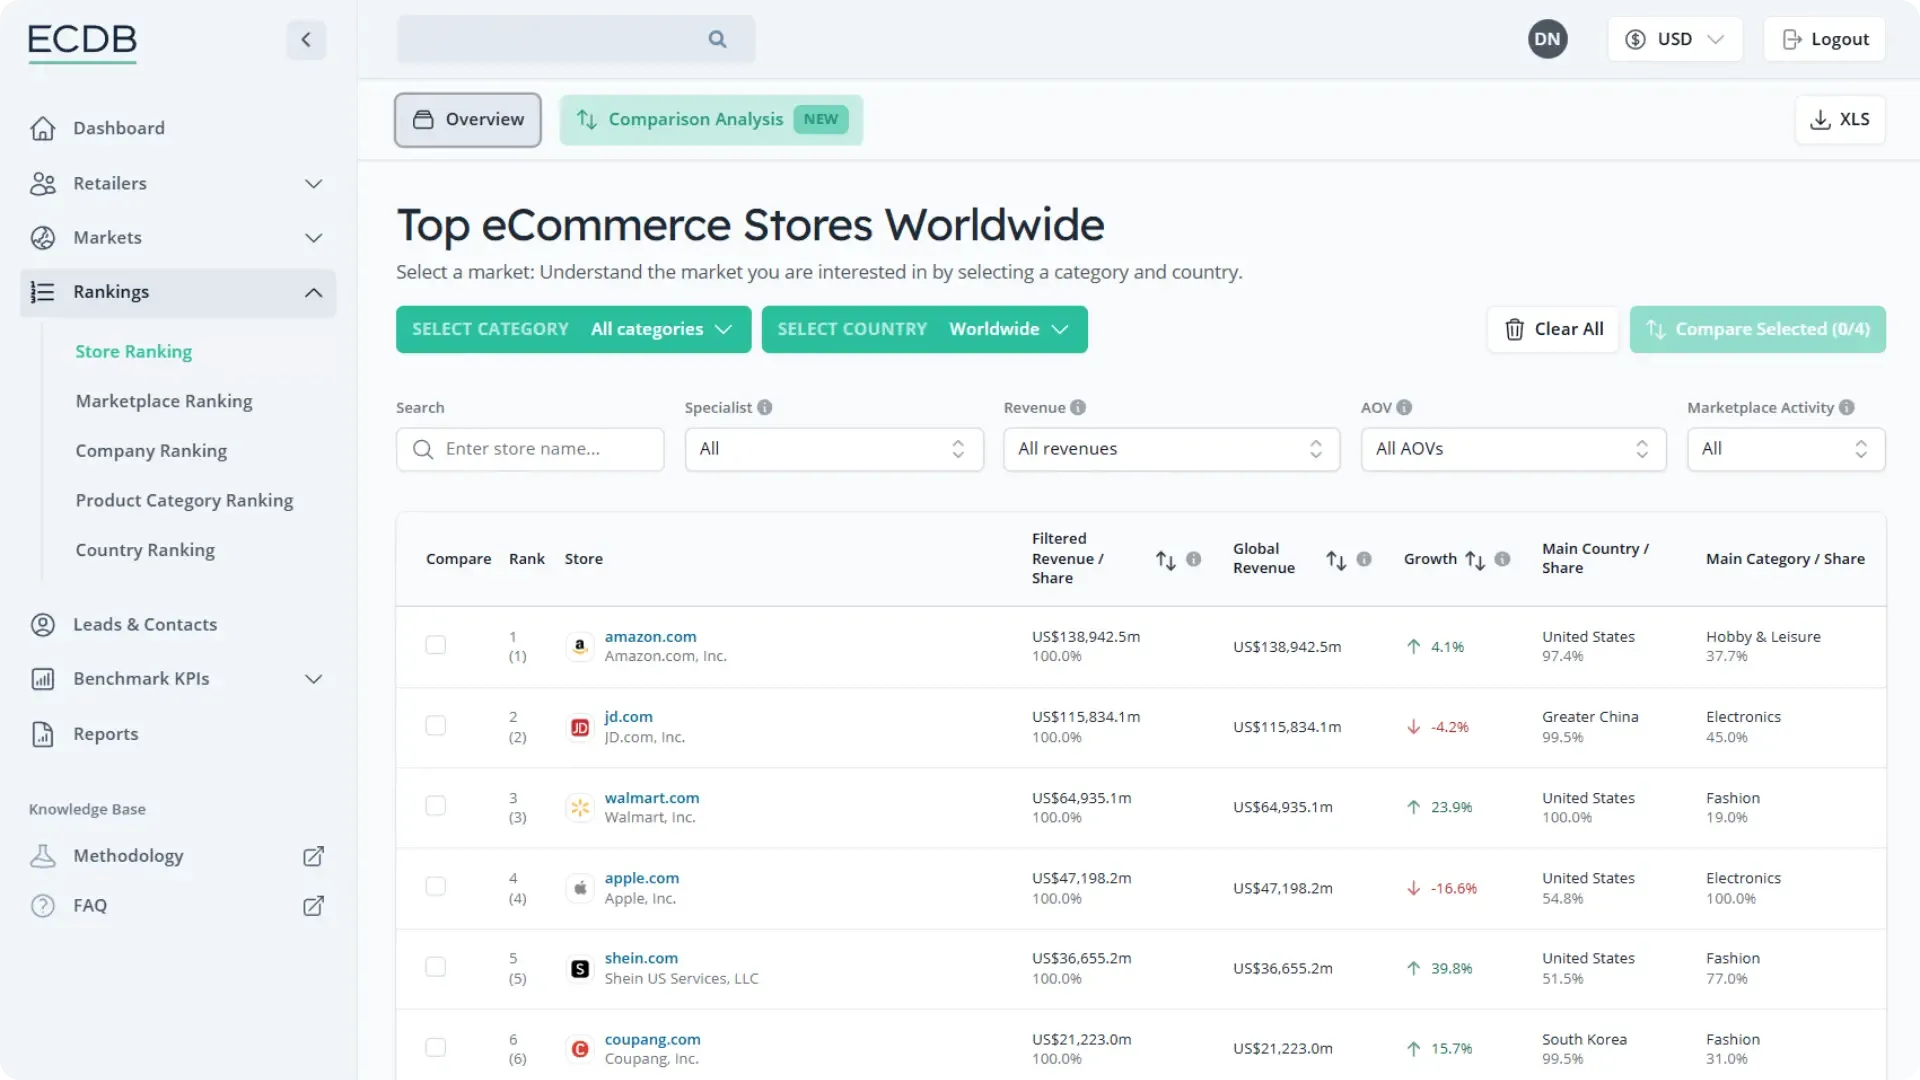
Select a market: Understand the market you are interested in by selecting a category and country.
Filter results: Drill down the ranking by different KPIs.
Search results
| Compare | Rank | Store | Filtered revenue / share eCommerce net sales refer to the year 2024 | Global revenue eCommerce net sales refer to the year 2024 | Growth eCommerce net sales growth refers to 2024/2023 | Main country / share | Main category / share | ||||||||||||||||||||||||||||||||||||||||||||||||||||||||||||||||||||||||||||||||||||||||||||
|---|---|---|---|---|---|---|---|---|---|---|---|---|---|---|---|---|---|---|---|---|---|---|---|---|---|---|---|---|---|---|---|---|---|---|---|---|---|---|---|---|---|---|---|---|---|---|---|---|---|---|---|---|---|---|---|---|---|---|---|---|---|---|---|---|---|---|---|---|---|---|---|---|---|---|---|---|---|---|---|---|---|---|---|---|---|---|---|---|---|---|---|---|---|---|---|---|---|---|---|
| 1 (22) | US$321.7m 3.0% | US$10,816.1m | 2.5% | United States 18.6% | Furniture & Homeware 72.2% | ||||||||||||||||||||||||||||||||||||||||||||||||||||||||||||||||||||||||||||||||||||||||||||||
| 2 (596) | US$258.2m 83.3% | US$310.0m | 10.4% | Australia 100.0% | Furniture & Homeware 83.3% | ||||||||||||||||||||||||||||||||||||||||||||||||||||||||||||||||||||||||||||||||||||||||||||||
| 3 (44) | US$230.6m 5.0% | US$4,612.9m | 11.5% | Australia 100.0% | Grocery 53.0% | ||||||||||||||||||||||||||||||||||||||||||||||||||||||||||||||||||||||||||||||||||||||||||||||
Get access to the Tooland join thousands of users Our easy way to get started - The Starter Access $250per month (billed annually / annual price $3,000) Buy NowBook a Demo Already have an account? Log in With our Starter Access, we offer you the perfect entry point to the ECDB data analytics hub.
       About the Store Ranking 
| |||||||||||||||||||||||||||||||||||||||||||||||||||||||||||||||||||||||||||||||||||||||||||||||||||
