Discover eCommerce countries worldwide
Unveil the global eCommerce landscape, examining market sizes across countries and emerging trends. Identify key insights into market development and discover top online retailers dominating specific markets. Get an overview of all countries included in ECDB below.

Overview of countries covered by ECDB
Use Cases
Check out all your exclusive benefits
Drive international growth
Analyzing revenues and revenue distribution across countries helps you pinpoint high-potential markets for tailored expansion efforts, driving overall business growth.
Monitor market trends
Tracking the growth trajectory and online share of the eCommerce market provides valuable insights into global market trends, enabling you to make informed decisions and adapt strategies accordingly.
Gain deep market insights
Unique KPIs such as online share provide detailed market insights, enabling you to understand your digital market presence within the broader retail landscape.
Examine eCommerce markets in detail
We provide insights into all the important eCommerce markets across the world. Whether you would like to have a global overview or look at a specific country, we have all the facts and figures.
Country Ranking
Identify the largest countries by eCommerce revenue
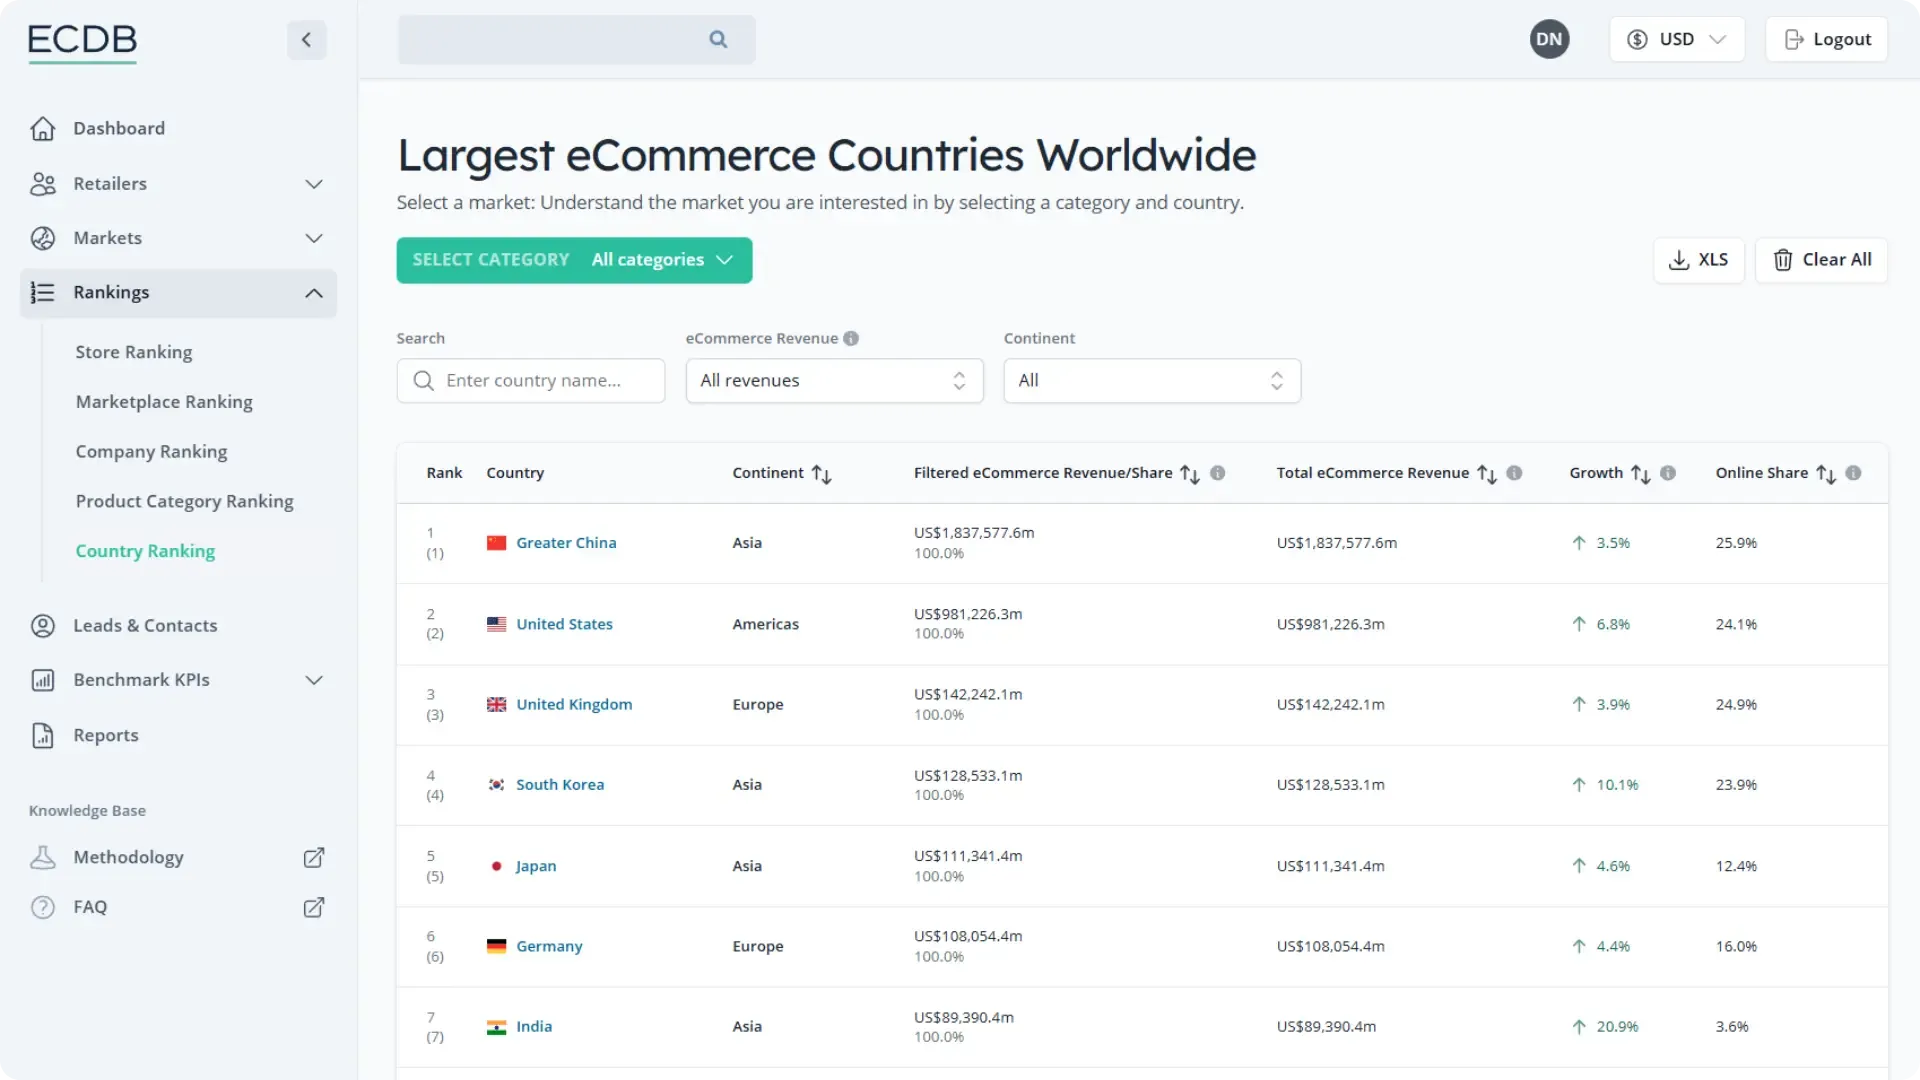
The global eCommerce market is led by Greater China with eCommerce revenues of US$1,906,621.5 million in 2024. Followed by the United States with sales of US$1,036,481.7 million and then the United Kingdom with sales of US$162,376.7 million. The ranking is based on the largest countries by eCommerce revenue in this market in 2024. Market revenue represents B2C sales of physical goods including VAT.
Search results
| Rank | Country | Continent | Total eCommerce revenue Refers to the total unfiltered eCommerce revenue of the country in 2024. Market revenue represents B2C sales of physical goods including VAT. It excludes B2B sales, C2C sales, returns, compensation for damaged or missing goods, any discounts granted and services. Data shown is using current exchange rates. | Growth Total unfiltered eCommerce revenue growth refers to 2024/2023 | Online share The online share refers to the proportion of the country’s retail volume that is transacted via the Internet. It includes purchases via desktop PC, tablet or smartphone, both via website or app. Only retail of physical goods is taken into account. Data refers to 2024. |
|---|---|---|---|---|---|
| 1 | Greater China | Asia | US$1,906,621.5m | 4.8% | 27.8% |
| 2 | United States | Americas | US$1,036,481.7m | 7.5% | 26.7% |
| 3 | United Kingdom | Europe | US$162,376.7m | 6.1% | 26.7% |
Country Overview
Explore our broad coverage of countries
Our market insights encompass 150+ countries.
- a
- b
- c
- d
- e
- f
- g
- h
- i
- j
- k
- l
- m
- n
- o
- p
- q
- r
- s
- t
- u
- v
- w
- z
Methodology
Our data & modelling approach
Data coverage
Data refers to B2C enterprises. Figures are based on the sale of physical goods via digital channels to a private end consumer. The following are not included: digitally distributed services, digital media, B2B, and the digital purchase or resale of used, defective, or repaired goods.
Modelling approach
Market sizes are estimated by using a top-down and bottom-up approach, combining financial reports, surveys, consumer data, key market indicators, and country-specific data (e.g. GDP, internet penetration).
Forecasts
Forecasts are made by using various techniques tailored to market behavior, e.g. S-curve function and exponential trend smoothing. Drivers include GDP per capita, consumer spending per capita, internet penetration, and population.


