Data Sources
Transaction data ensures a perfect data basis
ECDB uses different data sources as a basis for company revenue and market calculations plus KPIs. Transaction data from credit cards, debit cards, bank accounts & e-wallets are the most important one. All of the transaction data comes directly from card issuers or processors based on the transactions going over their networks.
ECDB processes more than 1 billion online & offline transactions per month. This represents approximately 2-3 % of all transactions for the analyzed companies or markets.
Almost real-time: The transaction data will be delivered with a delay of 7 days after the purchase event and will be immediately processed.
ECDB complements the transaction data with other information: company data from public companies, traffic & clickstream data, web scraping and crawling.
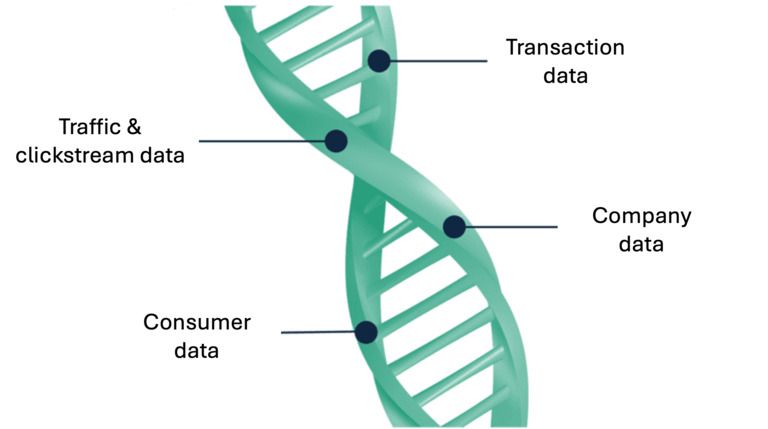
Our data sources
Transaction data
- Credit cards, debit cards, bank accounts and e-wallets.
- Transaction information: description, merchant name, industry sector, purchase amount, date of purchase.
- Daily data processing.
- Fully compliant with global privacy regulations.
Other data sources
- Company data from public companies: approx. 5% of relevant retailers are stock listed.
- Traffic & clickstream data.
- Web scraping & crawling.


“Transaction data are a fantastic source, but you need industry experts to translate the data into relevant business information such as revenues or market shares.”
Talk to an ExpertData Cleaning & Standardization
Conscientious data cleaning optimizes further processing
For us, the focus is always on high data quality. In order to be able to guarantee that, we require a data pool that is consistent in itself and which serves as the perfect foundation for modeling markets or companies.
Our data analysts therefore spend a lot of time standardizing and cleaning the data they have obtained. In the course of our data cleaning and standardization, different definitions are eliminated, and incorrect sources are sorted out.
Why data cleaning and standardization is relevant
For our extensive modelling, we need an excellent data basis, which can only be guaranteed by extensive preparatory work in the course of data cleansing and standardization.
The large number of sources on the eCommerce market is associated with a large number of different definitions. In order to be able to process them further, these definitions and the associated data must be harmonized.
As in many other areas, the eCommerce sector also contains a large amount of inaccurate or incorrect data. These can only be found and subsequently eliminated through a comprehensive analysis.
With our far-reaching processes for data cleaning and standardization, we are actively working on defining market standards and making the eCommerce market easier to access for our customers.


“Data cleaning and standardization is the essential step in order to create an optimal data basis for our modelings.”
Talk to an ExpertData Modeling
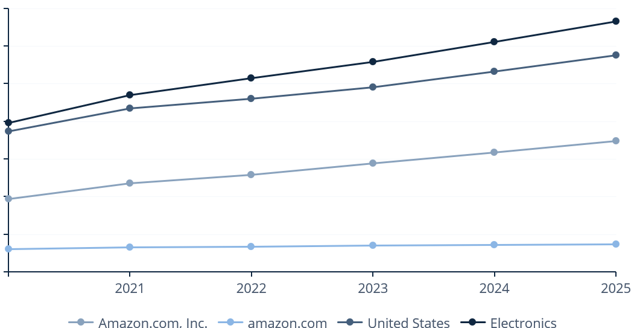
As the heart of our data process, modeling is the key to unique data
Data modeling by our analysts is the heart of data generation. Based on researched, collected, harmonized and cleaned data from the previous steps, the different datasets are compiled into a consistent data model.
Our experienced data analysts dive deep into individual markets, countries and players and merge all data strings. With the help of a variety of tools created in-house, this results in data modelings with unique data as its output.
What makes us unique in data modeling
We do not generate data and leave it unadjusted in the market. Instead, we regularly adjust our modelings and include new data points.
Each of our data analysts is a true expert in their market. Accordingly, collected data can be optimally processed and contextualized.
A large part of our modeling is carried out by our experienced data analysts. We use tools but put the analyst at the center of the data modeling.
We always access all plausible data on the market and use it in our modeling. This is the only way to develop a complete data pool.


“With data modeling as the heart of our data generation, we generate unique and always up-to-date data.”
Talk to an ExpertData Forecasting
Based on multifaceted analysis, our forecasts lead the way into the future
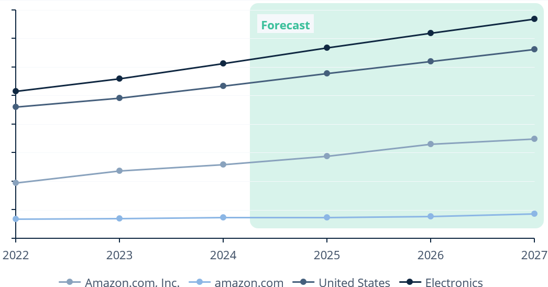
As ECDB, we not only provide detailed data on current and past years, but also take a look at developments in the coming years with our data forecasts. In order to do this, our analysts combine various data sources and use them to develop a forecast for markets and individual players.
Our analysts examine key performance indicators, general market forecasts, historical developments and statements by individual players, among other things, and develop a forward-looking picture of the eCommerce landscape.
Input data for our forecasts
Based on the developments of recent years or even decades, conclusions are drawn for the future and thus serve as a good basis for our forecast.
Any changes in macroeconomic parameters imply changes in the market environment and are incorporated into our forecasts accordingly.
The statements and information of individual companies provide valuable information on the future development of companies and markets.
The development of important key figures such as average order value, conversion rate or cart abandonment rate provide an indication of future developments in eCommerce.


“Our forecasts are based on many different data points and therefore show a multi-faceted picture of the future eCommerce landscape.”
Talk to an ExpertData Enrichment
A variety of eCommerce indicators further enrich the modeled data
The data modeled by our data analysts is supplemented by a wide range of indicators. These are obtained through expert research in combination with the latest tools and include a wide range of parameters on payment and shipping providers, store software, marketing performance and much more.
Together with the modeled data, the indicators offer a perfect symbiosis and enable a complete picture of individual retailers, countries or categories.

Indicators we are covering