Country ranking
Largest eCommerce countries worldwide
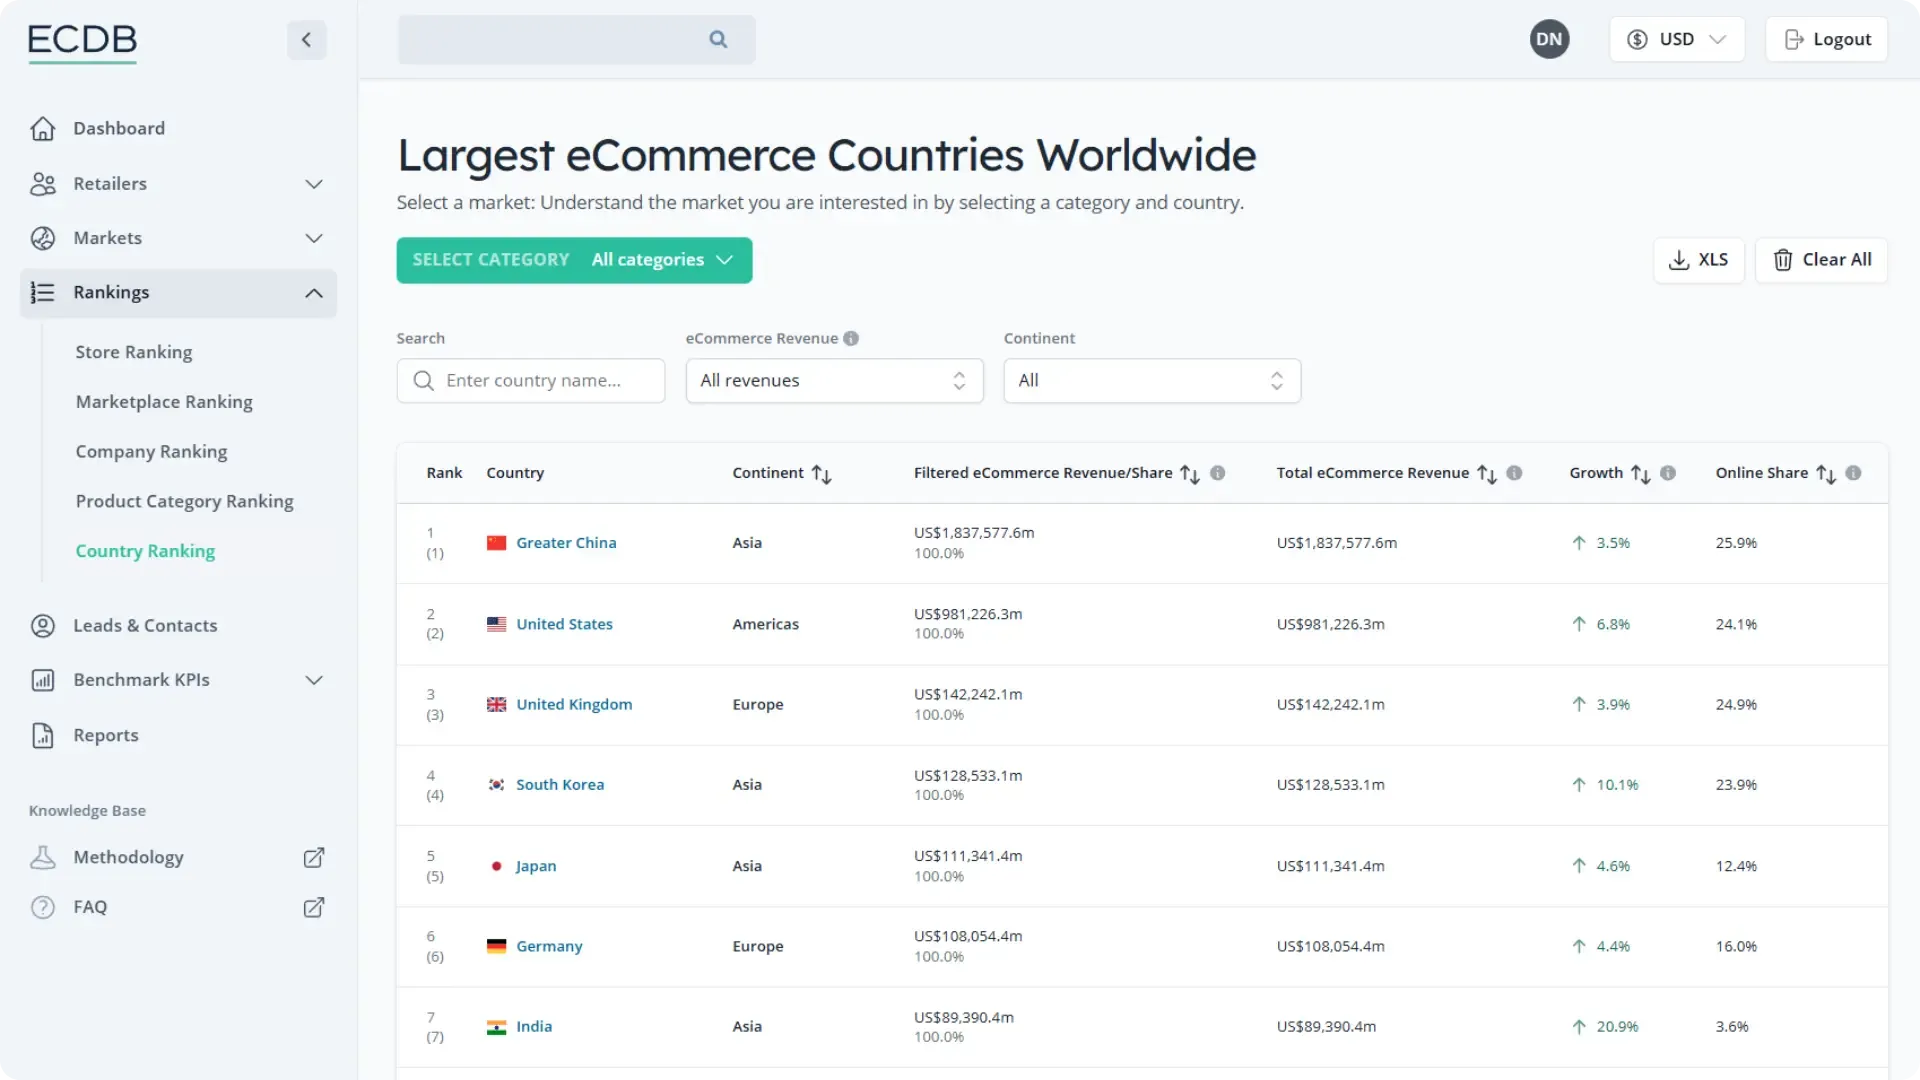
The global eCommerce market is led by Greater China with eCommerce revenues of US$1,906,621.5 million in 2024. Followed by the United States with sales of US$1,036,481.7 million and then the United Kingdom with sales of US$162,376.7 million. The ranking is based on the largest countries by eCommerce revenue in this market in 2024. Market revenue represents B2C sales of physical goods including VAT. By using the filters provided below, the list of countries can be narrowed down according to different types of research questions.
Advanced search filters
Select a market: Understand the market you are interested in by selecting a category.
Filter results: Drill down the ranking by different KPIs.
Search results
| Rank | Country | Continent | Filtered eCommerce revenue/share Refers to the eCommerce revenue of the country within the selected filters in 2024. Market revenue represents B2C sales of physical goods including VAT. It excludes B2B sales, C2C sales, returns, compensation for damaged or missing goods, any discounts granted and services. Data shown is using current exchange rates. | Total eCommerce revenue Refers to the total unfiltered eCommerce revenue of the country in 2024. Market revenue represents B2C sales of physical goods including VAT. It excludes B2B sales, C2C sales, returns, compensation for damaged or missing goods, any discounts granted and services. Data shown is using current exchange rates. | Growth Total unfiltered eCommerce revenue growth refers to 2024/2023 | Online share The online share refers to the proportion of the country’s retail volume that is transacted via the Internet. It includes purchases via desktop PC, tablet or smartphone, both via website or app. Only retail of physical goods is taken into account. Data refers to 2024. | |||||||||||||||||||||||||||||||||||||||||||||||||||||||||||||||||||||||||||||||||||||||||||||
|---|---|---|---|---|---|---|---|---|---|---|---|---|---|---|---|---|---|---|---|---|---|---|---|---|---|---|---|---|---|---|---|---|---|---|---|---|---|---|---|---|---|---|---|---|---|---|---|---|---|---|---|---|---|---|---|---|---|---|---|---|---|---|---|---|---|---|---|---|---|---|---|---|---|---|---|---|---|---|---|---|---|---|---|---|---|---|---|---|---|---|---|---|---|---|---|---|---|---|---|
| 1 (1) | Greater China | Asia | US$1,906,621.5m 100.0% | US$1,906,621.5m | 4.8% | 27.8% | |||||||||||||||||||||||||||||||||||||||||||||||||||||||||||||||||||||||||||||||||||||||||||||
| 2 (2) | United States | Americas | US$1,036,481.7m 100.0% | US$1,036,481.7m | 7.5% | 26.7% | |||||||||||||||||||||||||||||||||||||||||||||||||||||||||||||||||||||||||||||||||||||||||||||
| 3 (3) | United Kingdom | Europe | US$162,376.7m 100.0% | US$162,376.7m | 6.1% | 26.7% | |||||||||||||||||||||||||||||||||||||||||||||||||||||||||||||||||||||||||||||||||||||||||||||
Get access to the Tooland join thousands of users Our Bestseller - The Corporate Access $810per month (billed annually / annual price $9,720) Buy NowBook a Demo Already have an account? Log in With our bestseller, the Corporate Access, we offer you optimal access to the ECDB Data Analytics Hub.
       About the Country Ranking 
| |||||||||||||||||||||||||||||||||||||||||||||||||||||||||||||||||||||||||||||||||||||||||||||||||||
