ECOMMERCE: LOGISTICS
Reverse Logistics: Market Development, Top Returned Product Categories, eCommerce Returns
Online returns are a leading contributor to the global reverse logistics market, which continues to expand. Discover market projections for the reverse logistics industry and the top returned product categories globally, alongside the in-store vs online return share in the U.S.
Article by Nashra Fatima | April 29, 2024
Global Reverse Logistics: Key Insights
Market Size: With a CAGR (2022-2029) of 5.3%, forecasts put the reverse logistics market size at US$700 billion in 2023. It is likely to reach US$955 billion by 2029.
Most Returned Categories Bought Online: In 2023, products bought online in the category Fashion were returned the most, followed by DIY.
Online versus Offline Returns: Although online sales make up only a quarter of the total retail market in the U.S., they drive high returns. Most returns are found to originate from online purchases in 2023.
The surge in online shopping comes with an inevitable side effect: product returns. Customer decisions to send back items that they buy online are shaping return policies as well as contributing to the expansion of the reverse logistics market.
The global reverse logistics market is growing. Find out the projections for the reverse logistics market alongside the top product categories bought online and the share of eCommerce returns in total retail returns.
Global Reverse Logistics: Market Development from 2022 to 2029
Despite attempts to curb returns, data indicates that product returns are increasing, contributing to the expansion of the worldwide returns market.
The size of the global reverse logistics market is growing at a CAGR (2022-2029) of 5.3%. At this rate, estimates put the market size at US$700 billion in 2023.
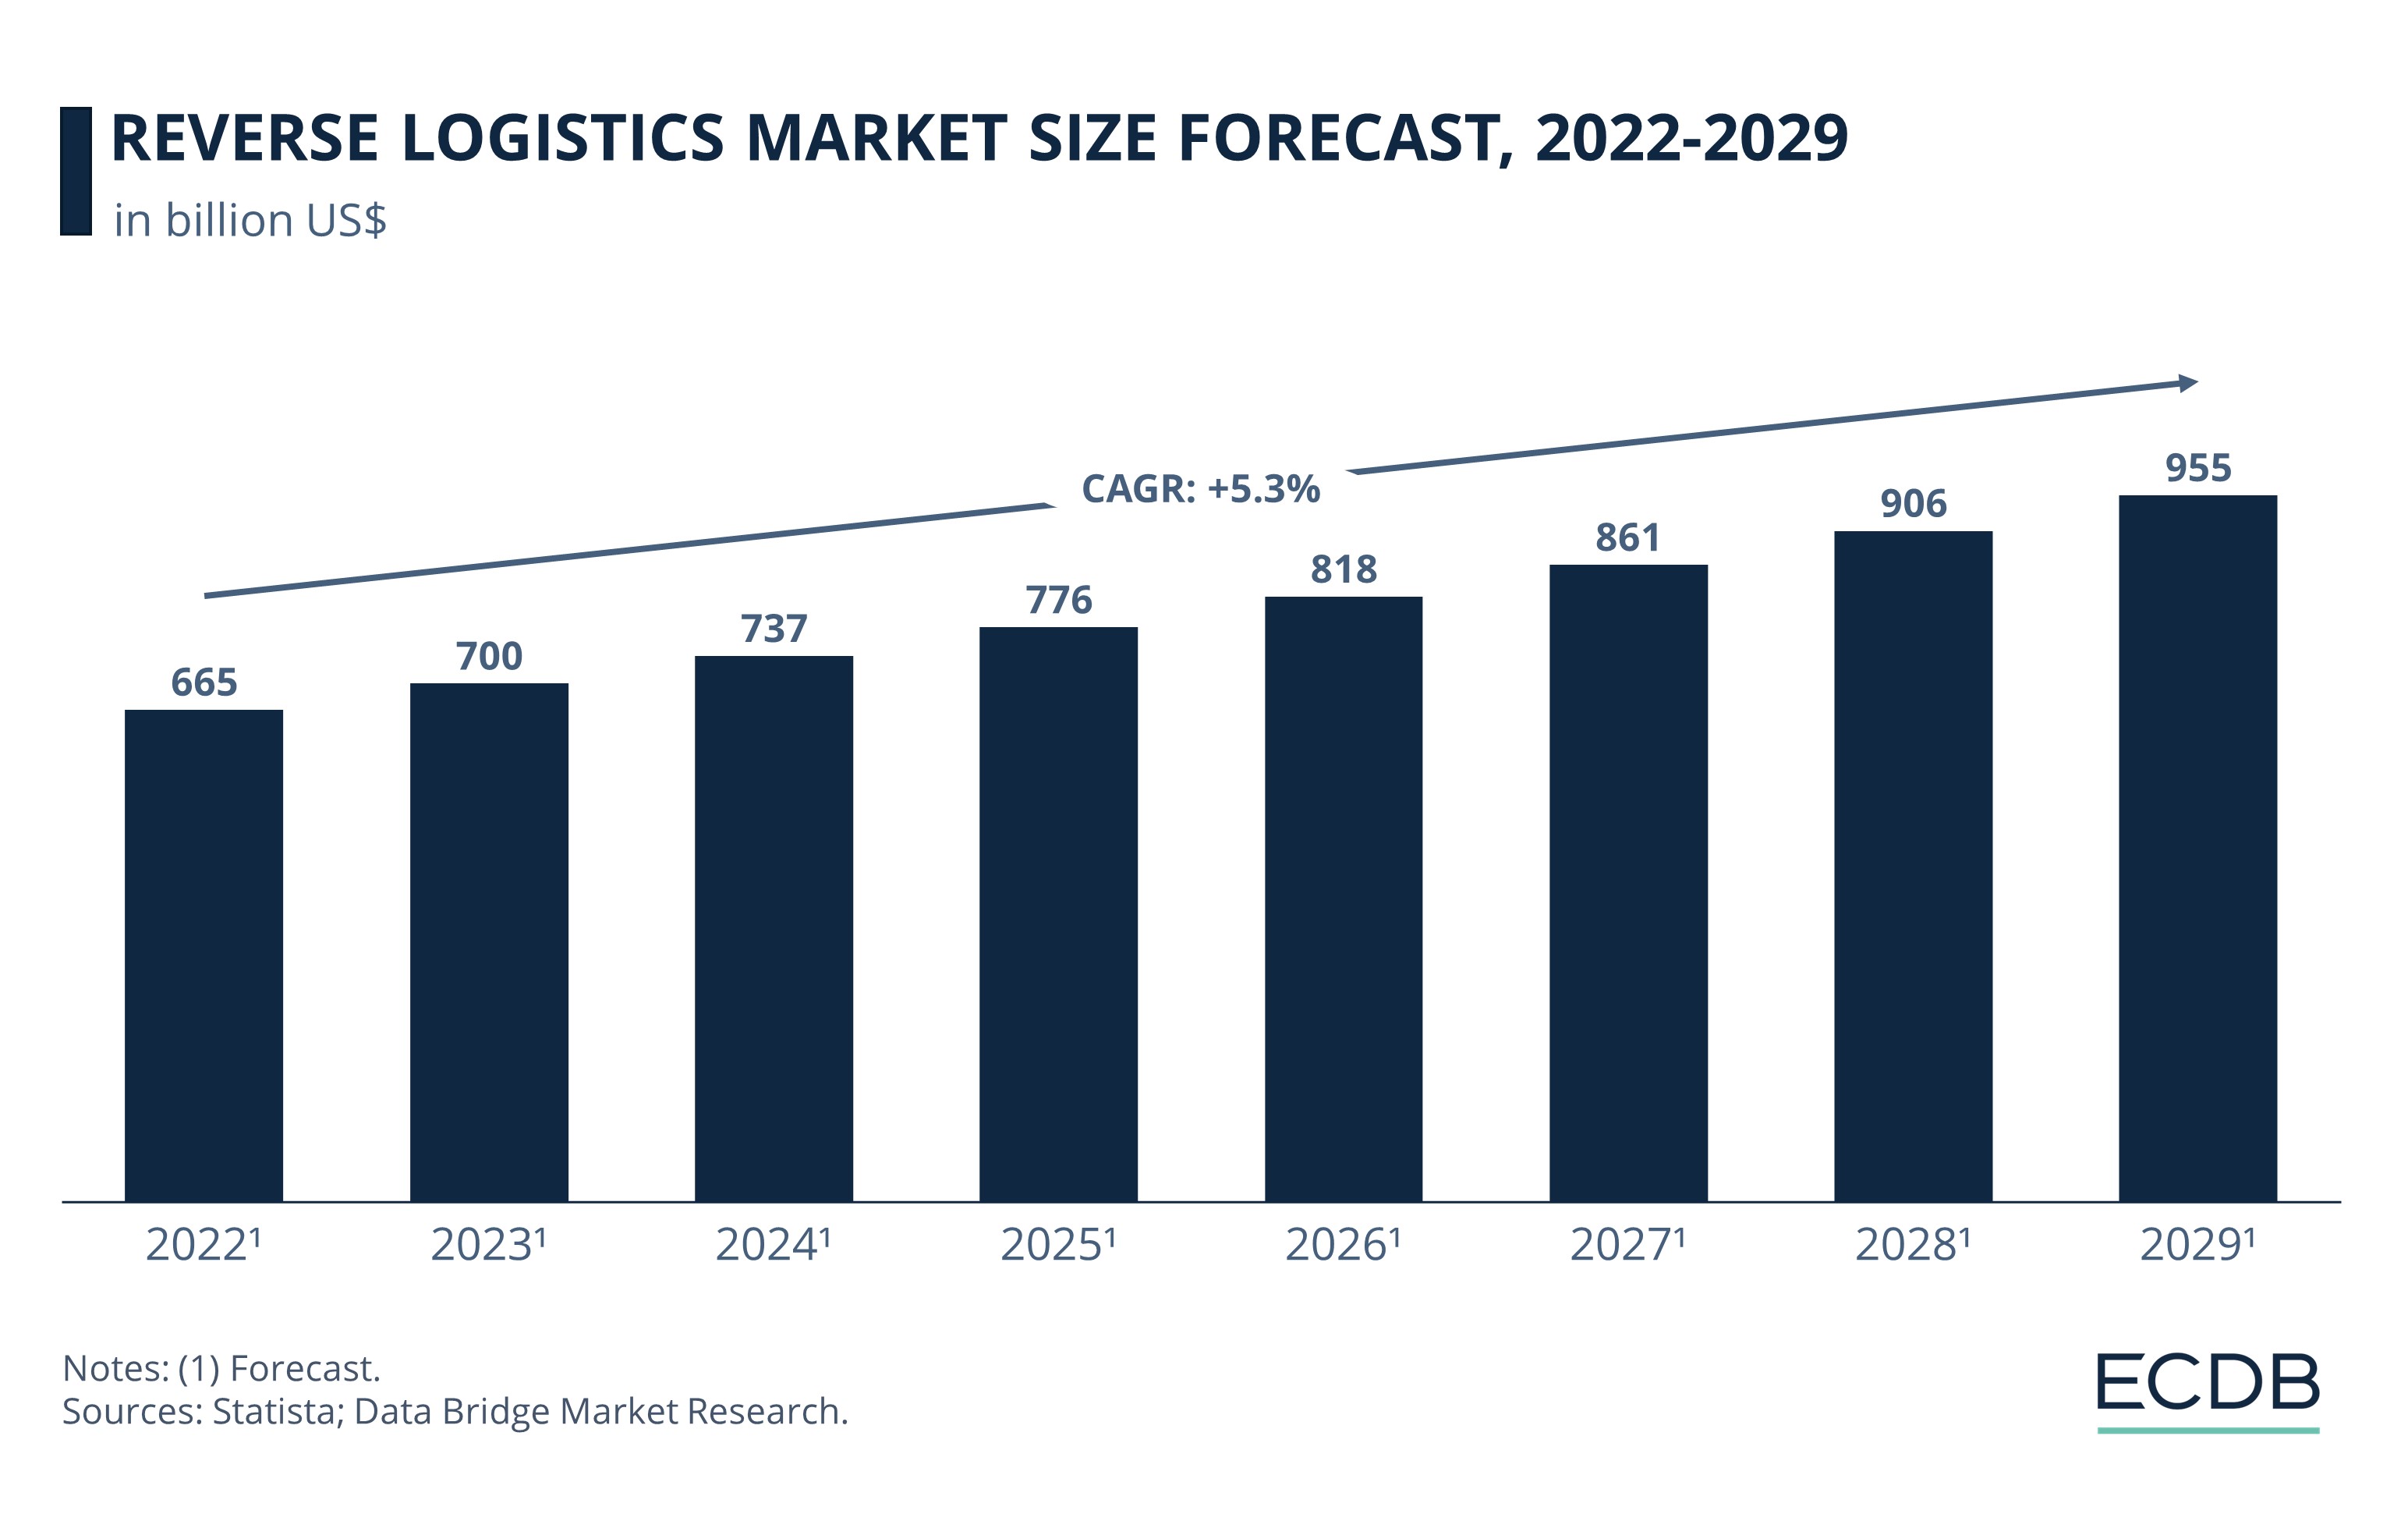
The reverse logistics market size includes revenues from activities like returns management, repair, resale, recycling, and disposal of returned products. Its expansion offers opportunities, such as improving sustainability standards and customer experience. But it also poses challenges, like increasing costs and complexity in managing high returns volume.
The market is not expected to shrink in the coming years. Projections place the market size at a substantial US$955 billion by 2029.
The rise in online shopping is a key contributor to the returns market, with some categories driving much higher returns than others.
Most Returned Product Categories: Fashion Tops the Global List in 2023
Our ECDB data shows that Fashion recorded the highest returns in 2023, out of all product categories bought online.
16% of Fashion products bought online were sent back by customers. This includes items from the sub-categories apparel, bags and accessories, and footwear.
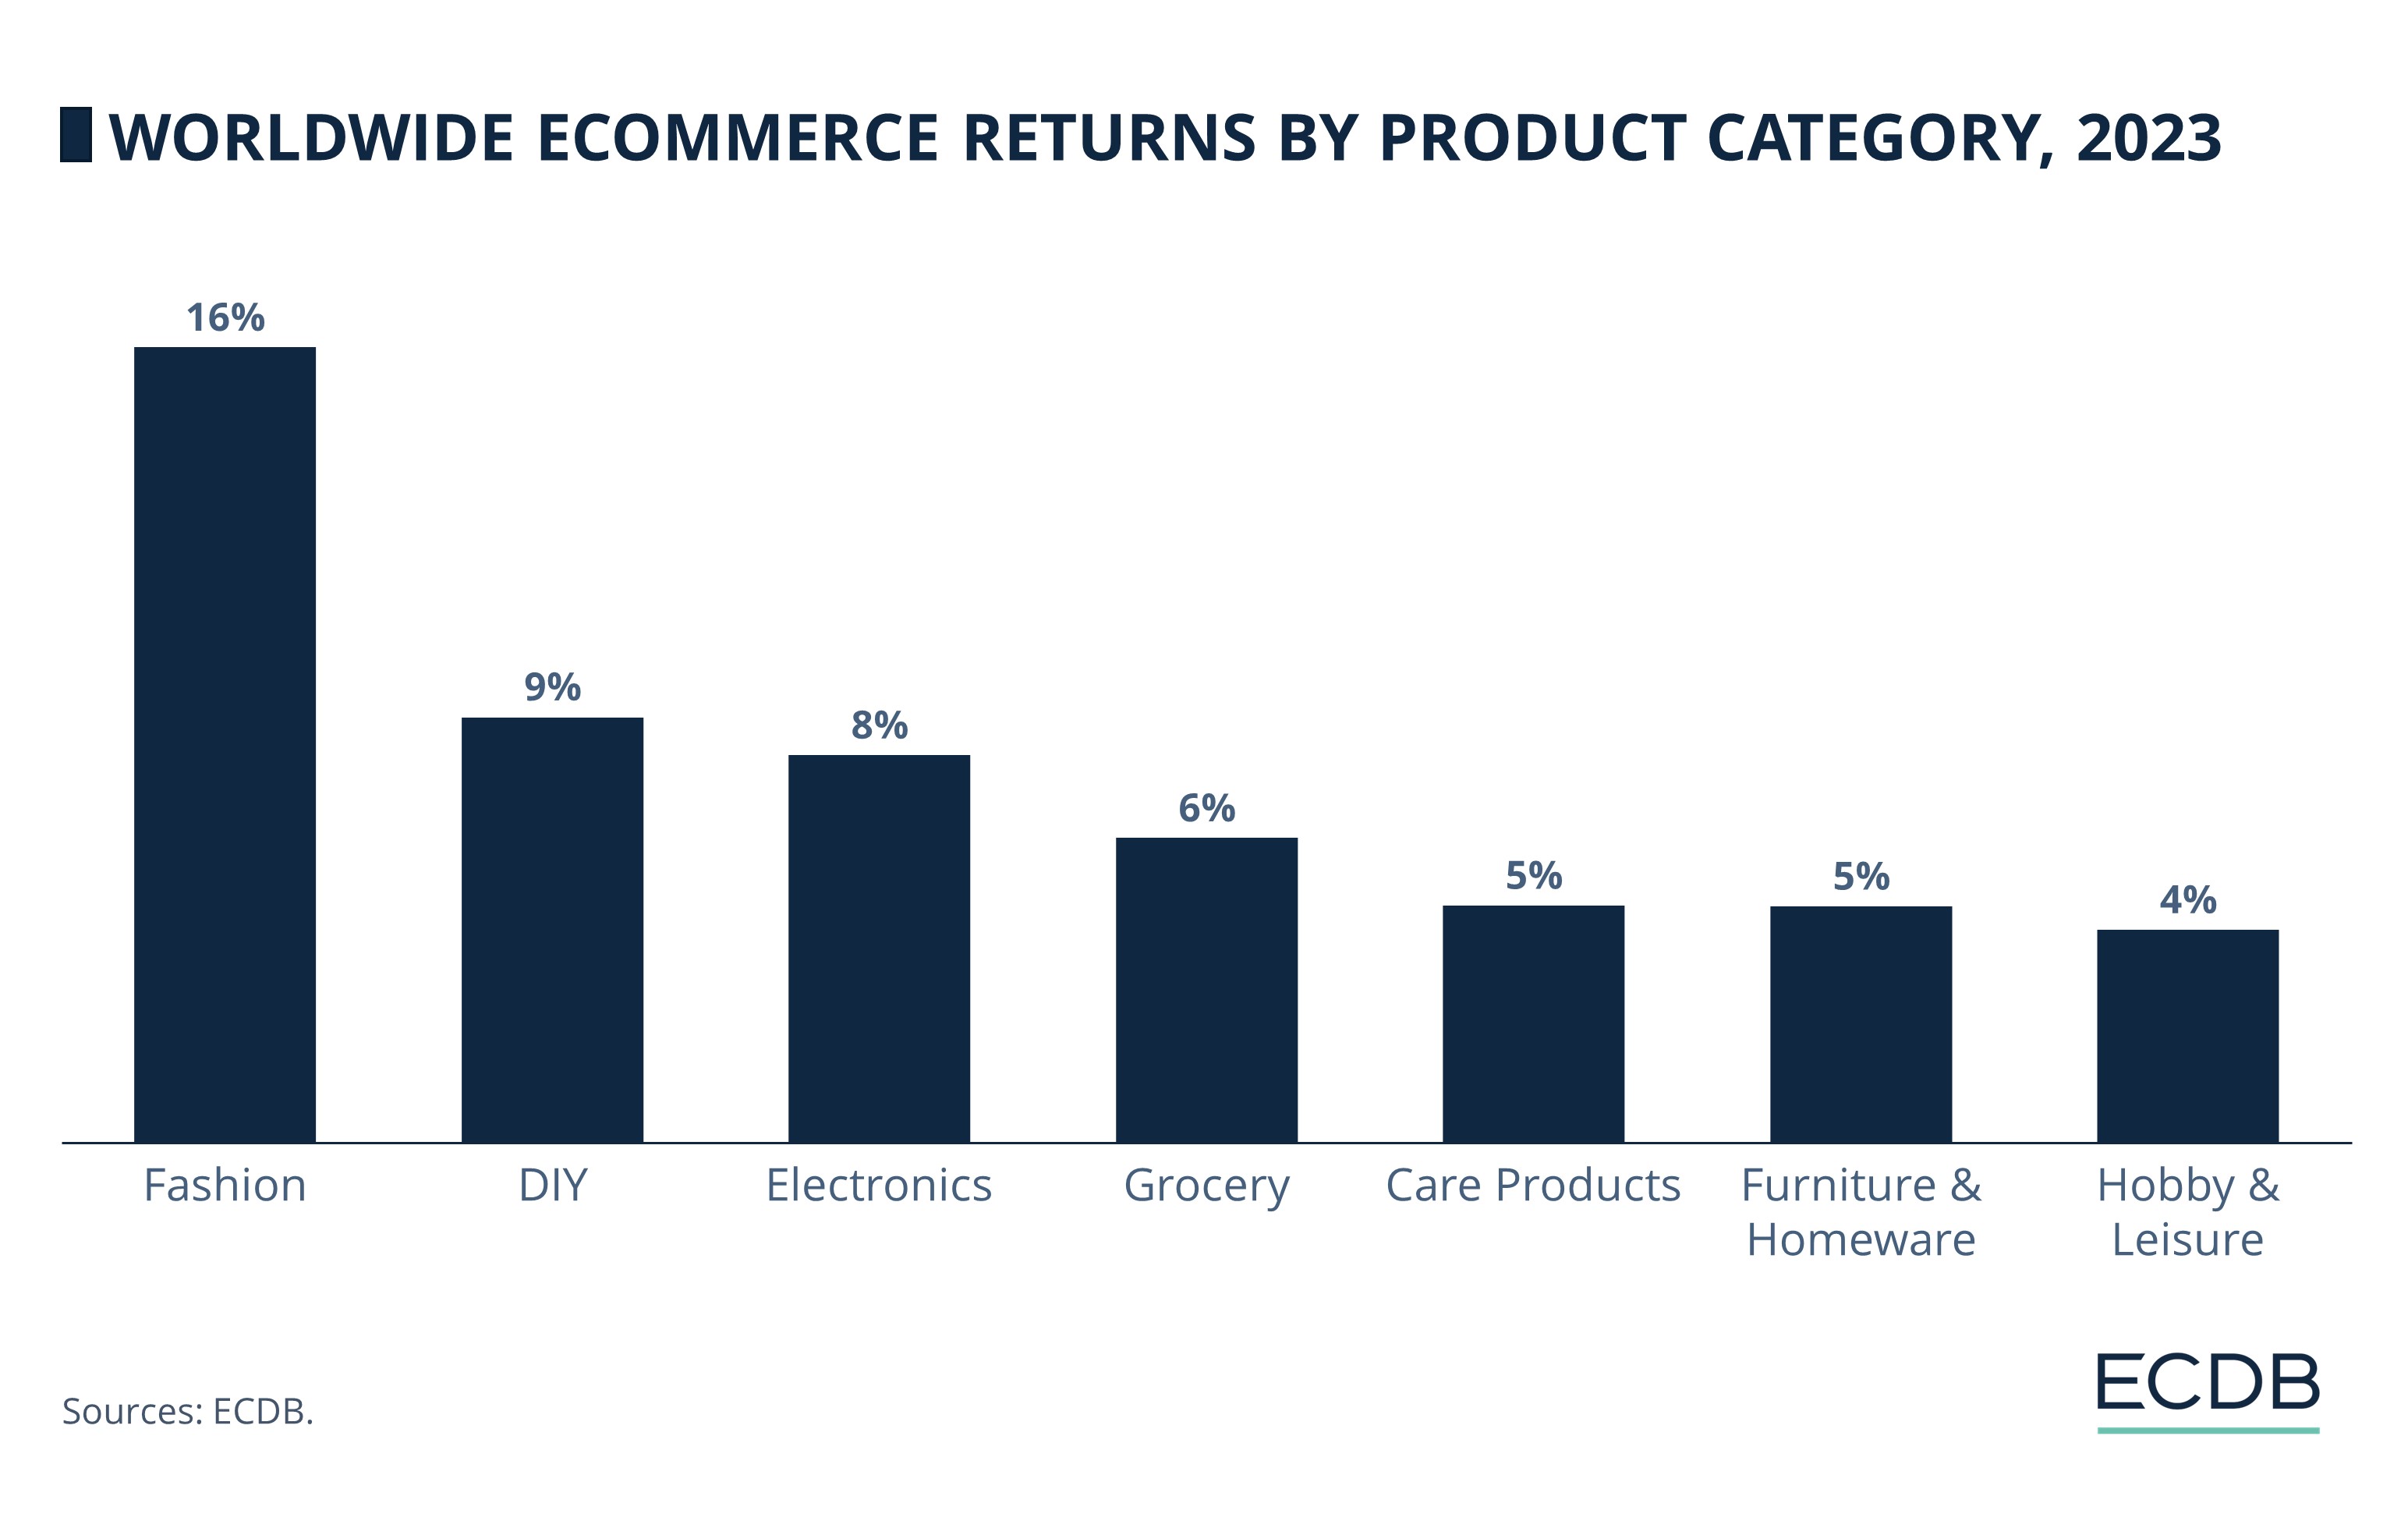
The return rates in Fashion have not fallen below 15% since 2020, suggesting that the returns trend in this category is persistent. Typical reasons for fashion product returns in eCommerce include sizing issues, mismatched item descriptions, poor product quality, or damages.
DIY stands second at 9% and Electronics third with 8%. Compared to these, Grocery, Care Products, and Furniture & Homeware have lower return rates at 5% each.
This data covers the return of products bought online. Although the global online retail share is smaller than the share of in-store shopping, products purchased online constitute the larger portion of returns.
Below, we look at the dynamics of the returns market in terms of in-store and online retail in the United States, which is the second-largest market for eCommerce worldwide.
The Retail Industry in the United States: In-Store versus Online Sales, 2023
Our ECDB data reveals the United States eCommerce market generated online revenues worth US$981 billion in 2023.
Physical or in-store sales are still predominant in the U.S., making up 76% of the total retail industry. Online retail accounted for a quarter (24%) of all retail sales in 2023.
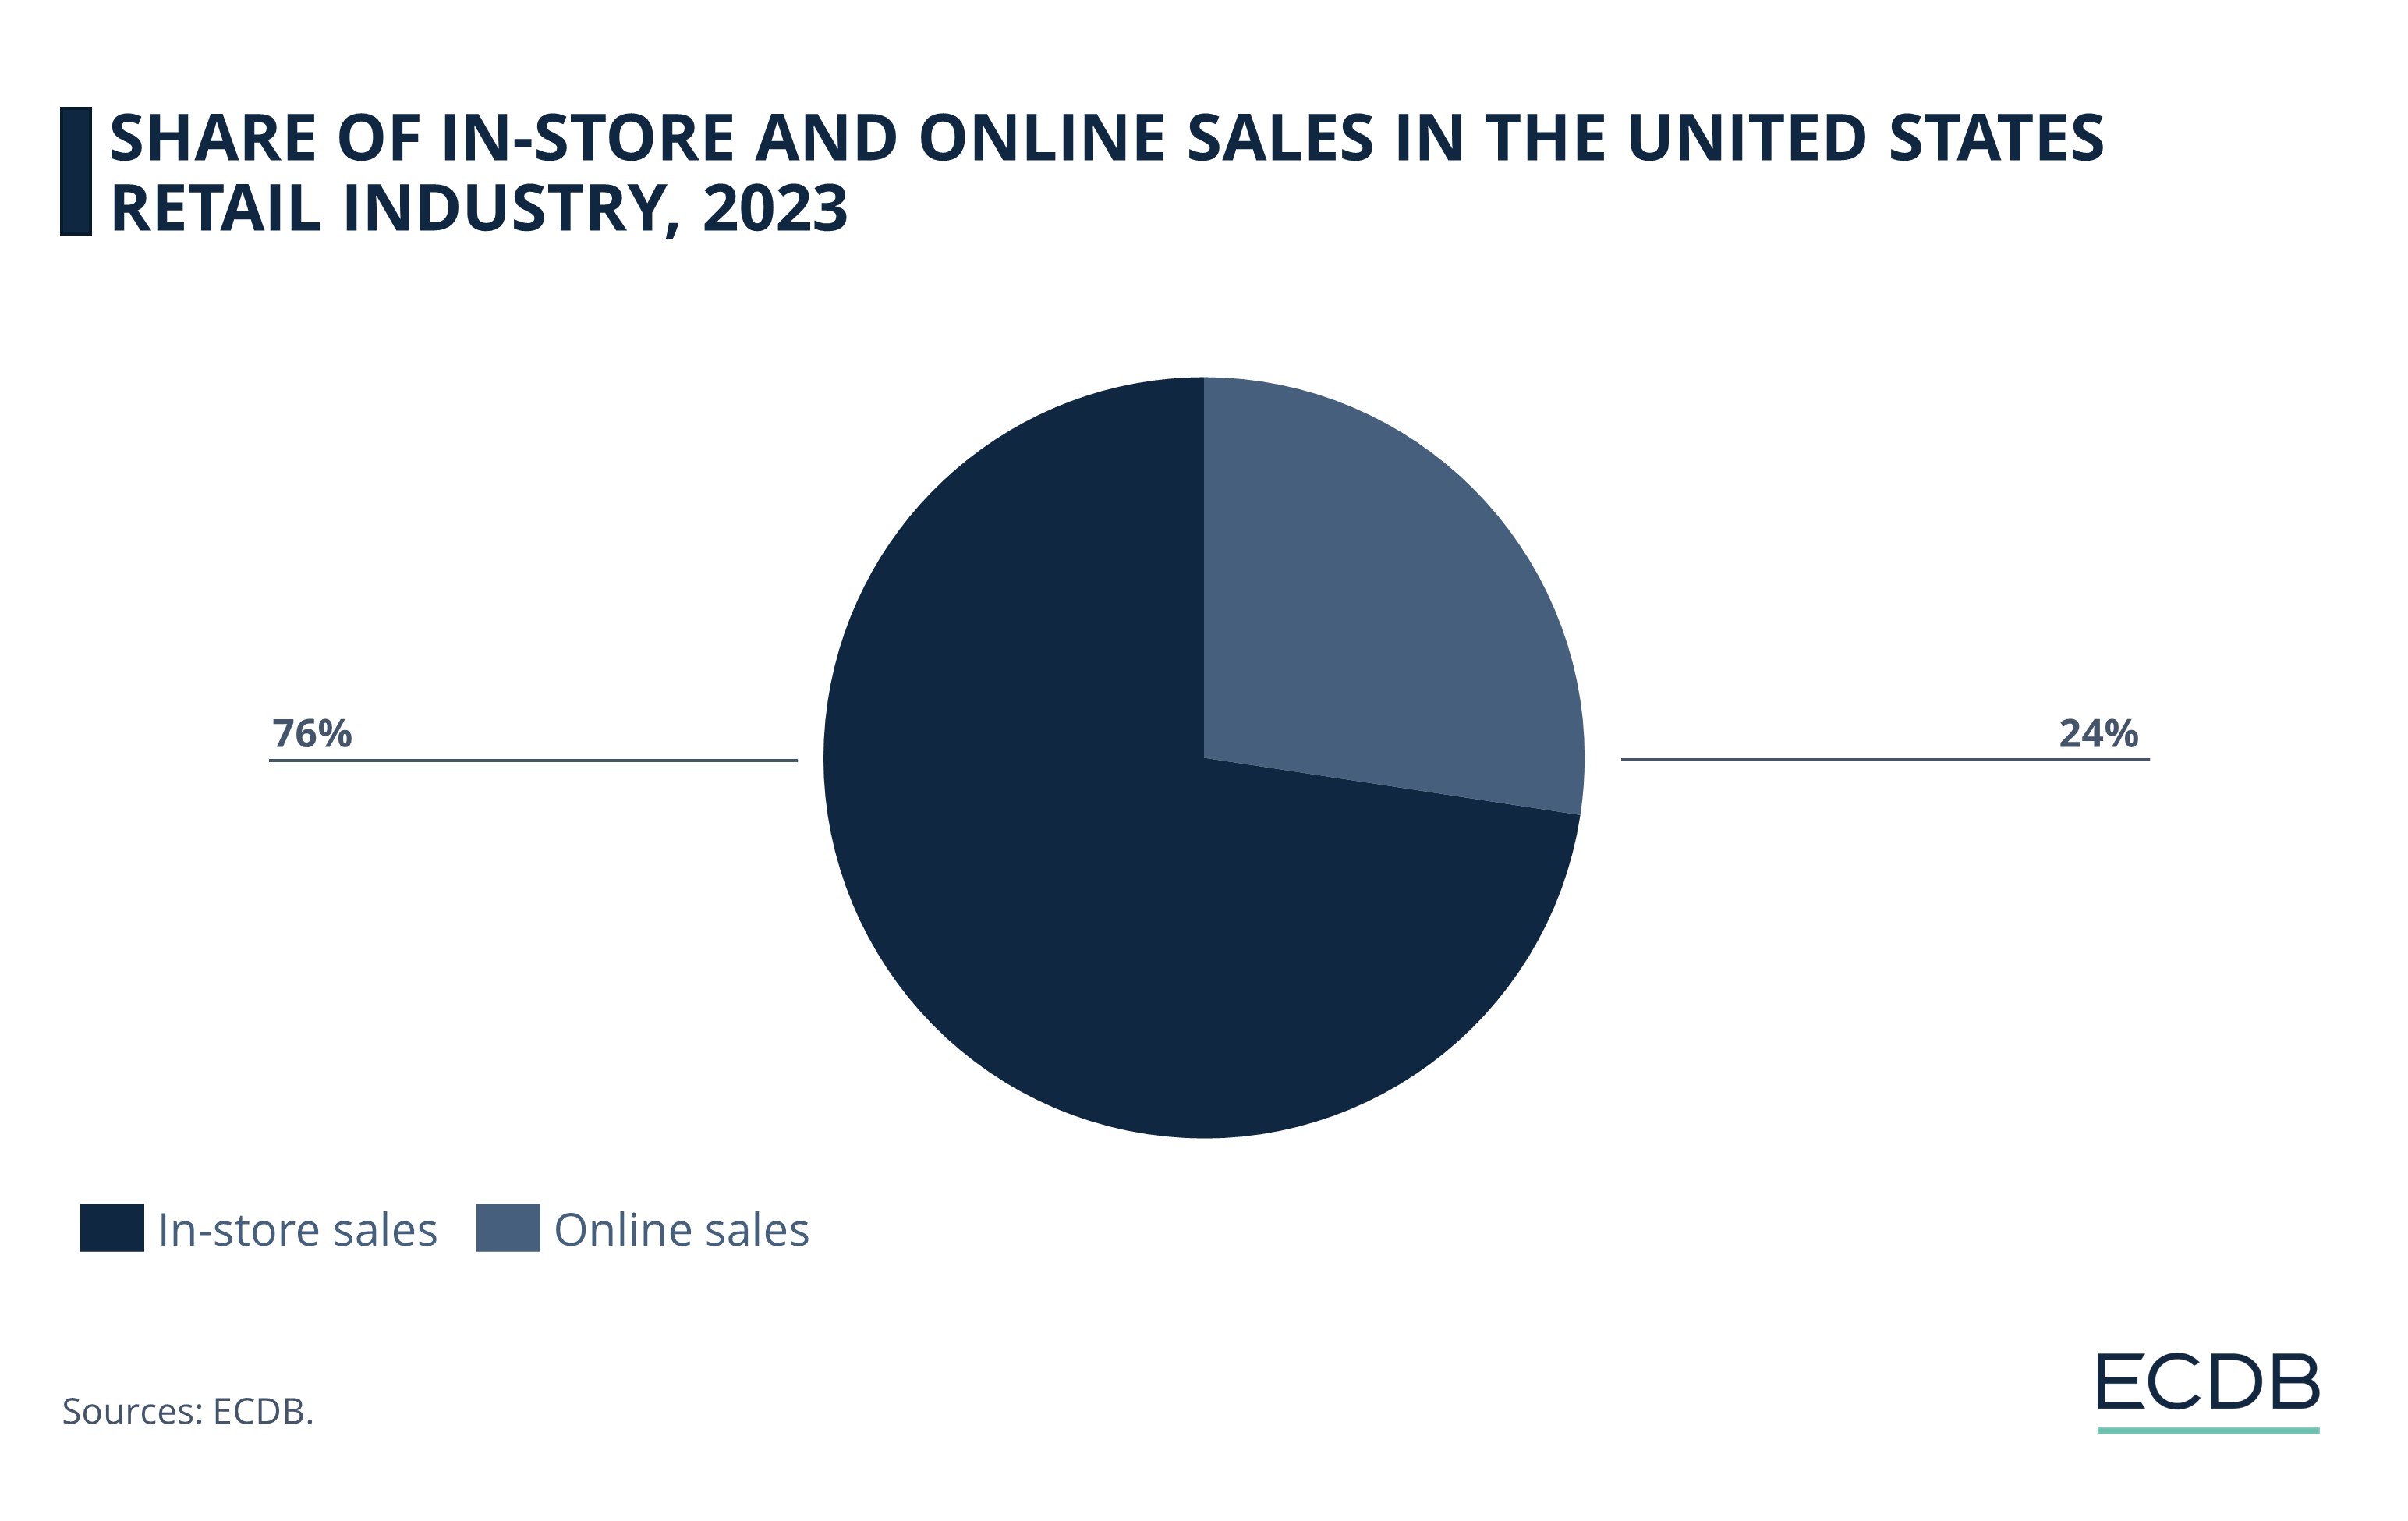
But eCommerce sales are growing . The share of online retail to total retail is growing at an average rate of 9.4%. By 2028, eCommerce sales are predicted to make up 38% of the total retail sales in the United States.
As more customers start buying products online, they also avail themselves of the returns option. Data shows that online returns and returns originating from online sales are proving to be costly for retailers.
Retail Returns in the United States: Share of In-Store and Online Returns in 2023
According to the National Retail Federation (NRF), 15% of all U.S. retail sales in 2023 were returned. From an online versus offline perspective, a larger share of products bought online than offline were sent back.
The value of online sales reported by NRF is different from ECDB due to different methodologies. Moreover, the retail return figures are based on the value of goods returned rather than the entire reverse logistics market which includes other returns-related activities.
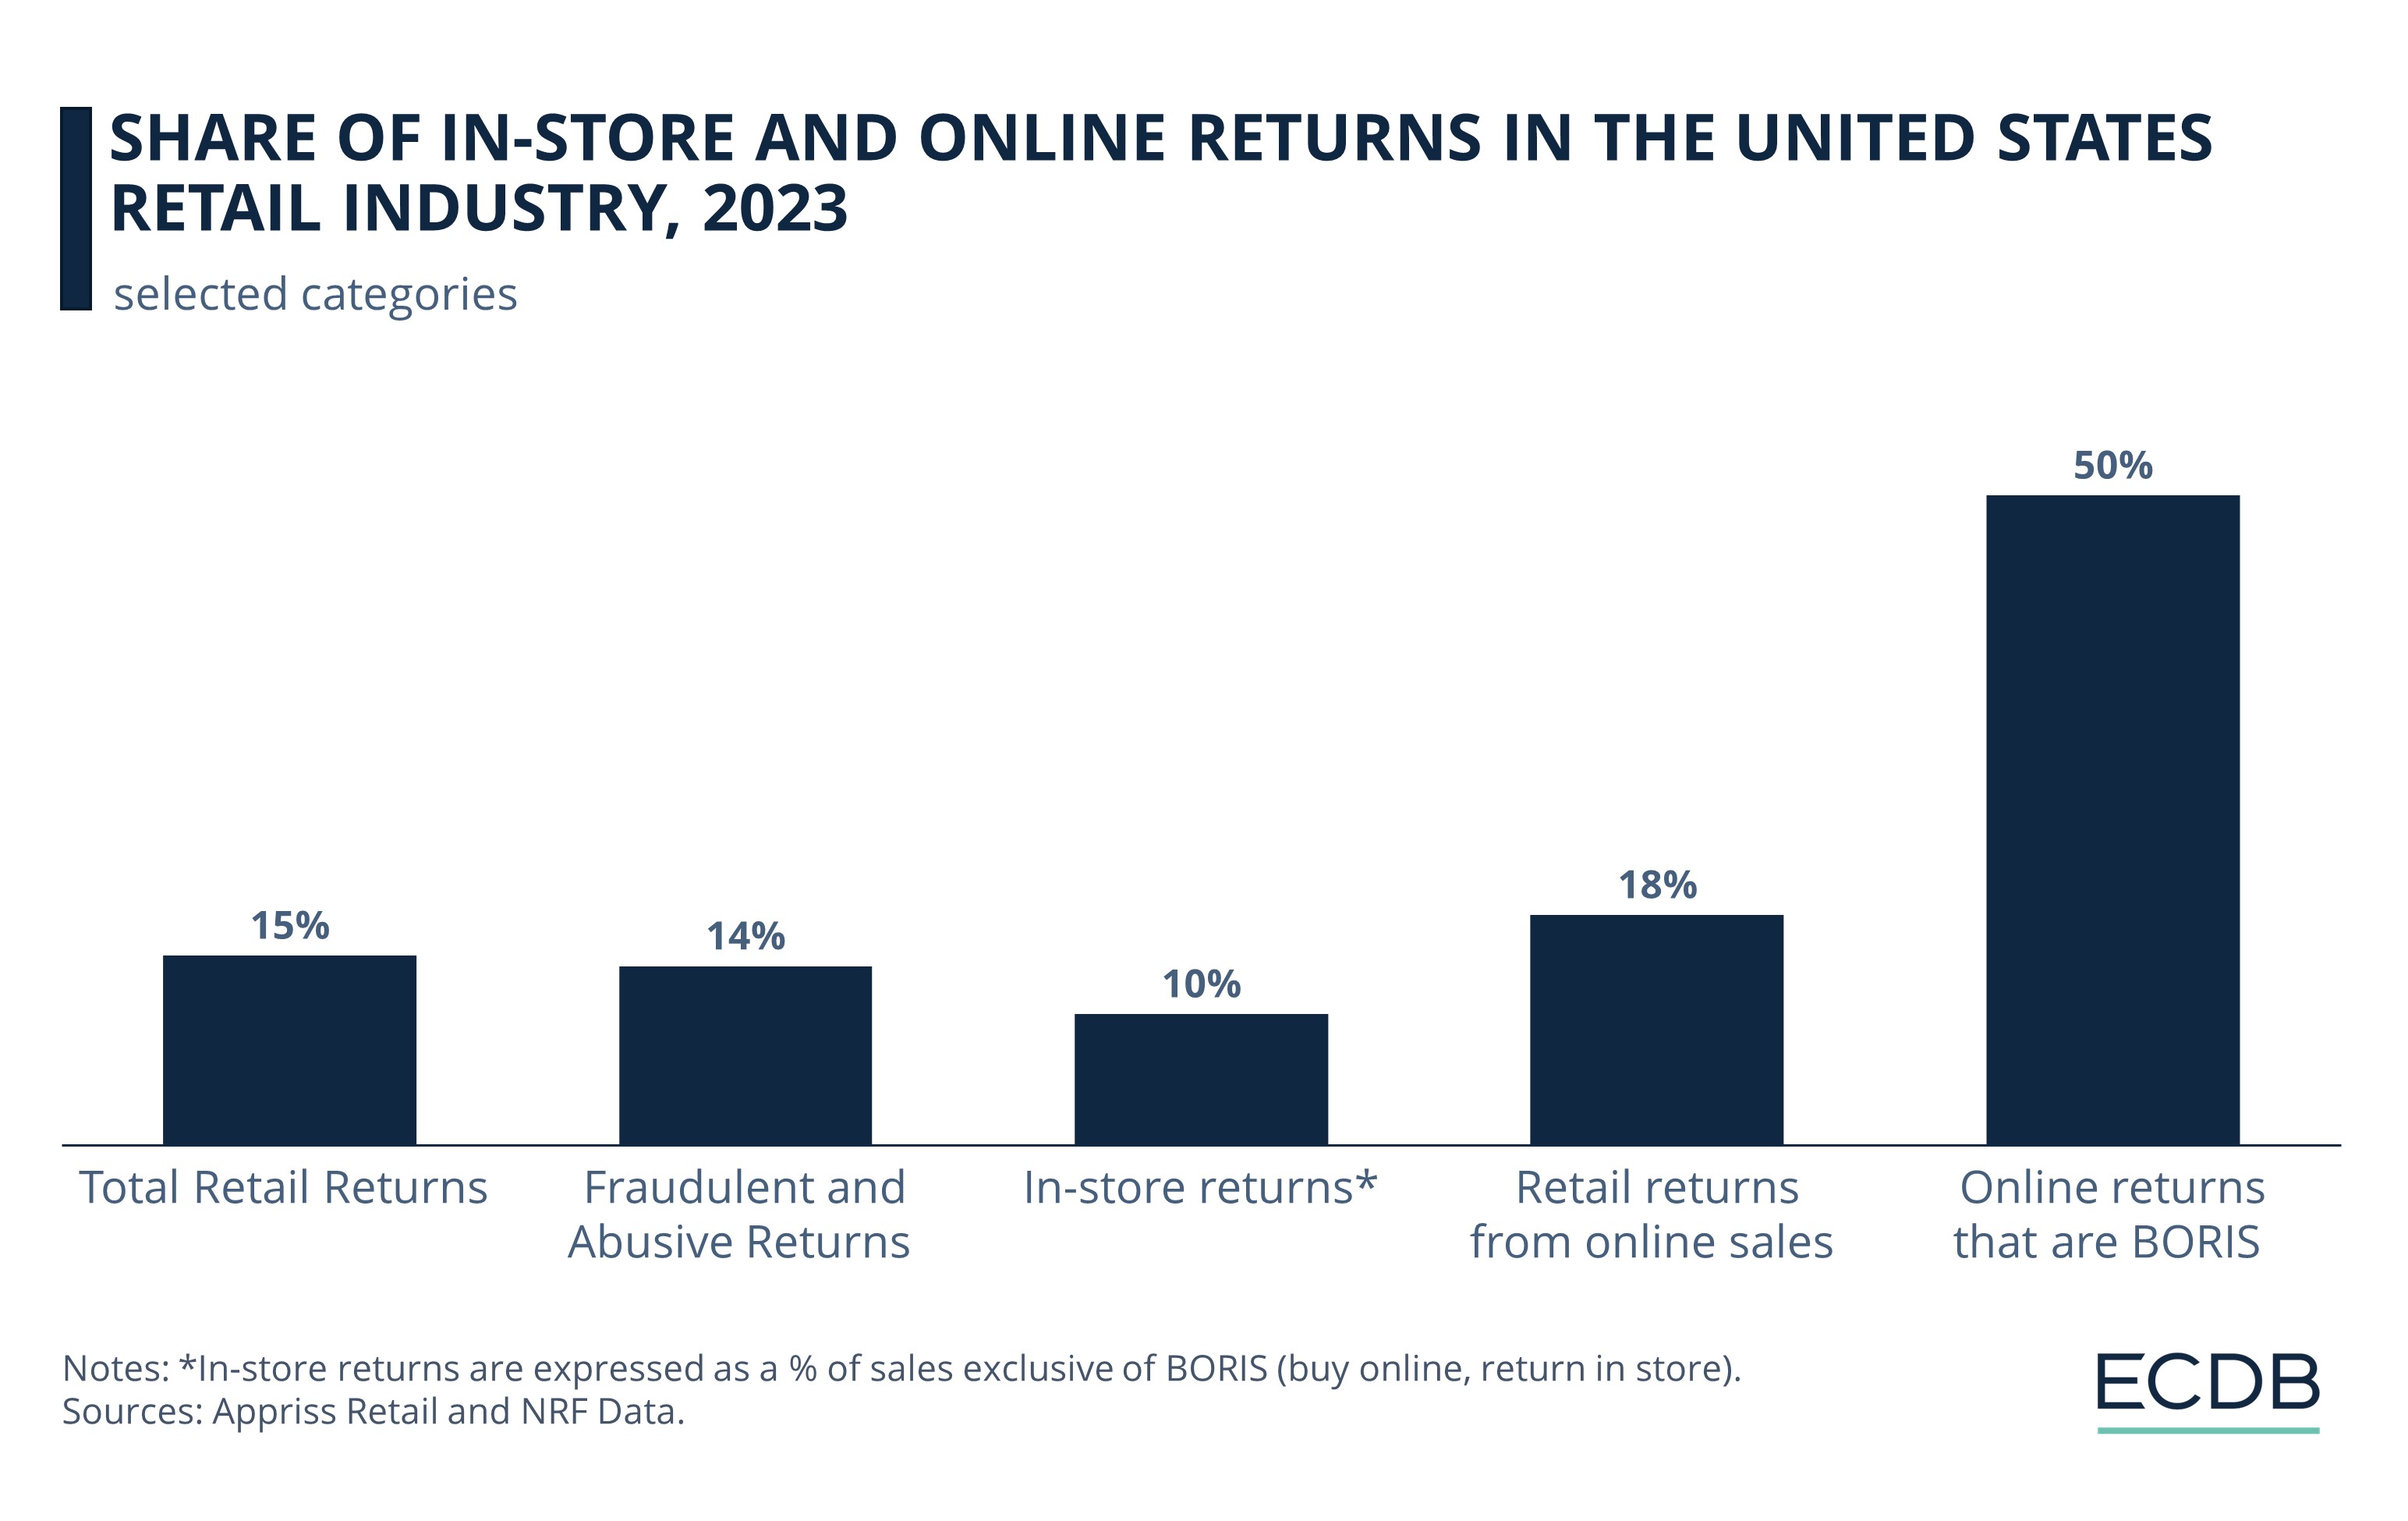
Retail returns from online sales include products shipped back by online shoppers as well as those returned in-store. The return share of products purchased online stands at 18%, putting the cost of returned merchandise bought online at a staggering US$247 billion.
In comparison, 10% of goods purchased in brick-and-mortar stores were returned. Since the size of the offline market is larger, in-store returns amount to US$373 billion. This share only includes products bought in-store. When including those products that are bought online but returned in store (BORIS), the in-store return rate climbs to 13%.
The acceleration of online sales is, thus, directly influencing the in-store return rate. As the numbers indicate, half of all brick-and-mortar returns are BORIS. In other words, merchandise worth US$123 billion is returned in-store, but it was purchased online in the first place.
Return policy, whether for in-store or online returns, is an important buying factor for customers who expect product returns to be easy and free-of-cost. While stores often cater to this demand, returns, in fact, are not free, as retailers must absorb the costs of return shipping, repair, disposal, or recycling of returned items.
Policies that are too flexible also tend to expose retailers to fraudulent returns, which are a cause of growing concern. The data from NRF reveals that the share of fraud impacting total returns stands at 14% in 2023 – a massive US$101 billion.
Reverse Logistics Market: Closing Remarks
As the reverse logistics market expands, it makes returns management more difficult for retailers. To mitigate costs but also maintain efficiency and good customer experience, companies are forming strategic partnerships.
ReturnLogic and Happy Returns have recently partnered to provide cost-effective and eco-friendly returns solutions. Amazon and FedEx were also prompted to consider collaborating in order to tackle the increasing return volume, albeit to no fruition yet.
Online shopping is found to be a significant factor behind rising returns, with repercussions including monetary loss and environmental harm. The conditions necessitate a shift from both consumer and retailers’ ends. Smart policies and conscious return decisions may help to positively redirect the reverse logistics market.
Sources: National Retail Federation
Related insights
Article
Video Games Market in 2024: Market Revenues, Segments, Regions & Top Companies
Video Games Market in 2024: Market Revenues, Segments, Regions & Top Companies
Article
Top Amazon Rivals: The Tech Giant’s Biggest Competition
Top Amazon Rivals: The Tech Giant’s Biggest Competition
Article
Top 10 Online Stores in the U.S: Amazon Sold More Than All Other Top 5 Stores Combined
Top 10 Online Stores in the U.S: Amazon Sold More Than All Other Top 5 Stores Combined
Article
Prada & Prada Beauty Analysis: Business Model and Global Net Sale
Prada & Prada Beauty Analysis: Business Model and Global Net Sale
Article
UK Fashion Market: Brands ASOS and Boohoo Under Scrutiny For Greenwashing
UK Fashion Market: Brands ASOS and Boohoo Under Scrutiny For Greenwashing
Back to main topics