eCommerce: Amazon Analysis
Amazon in Numbers 2024: Find The Best Store For Your Product
According to ECDB data, Amazon's GMV is expected to reach approximately US$757 billion in 2024, with forecasts predicting even higher figures in 2025. How can you claim your share of this growth? Discover the best niche for your venture with ECDB.
Article by Patrick Nowak | September 02, 2024Download
Coming soon
Share
Amazon in Numbers 2024: Key Insights
Amazon's Dominance: Amazon's projected GMV of US$757 billion in 2024 reflects its expansive reach across 22 domains worldwide.
Top Growth Markets: Among the top 5 Amazon markets, Amazon.ca is the fastest-growing, making it a prime choice for new sellers.
Key Product Categories: In Canada, Electronics and Hobby Products account for nearly 74.5% of sales, highlighting where the demand lies.
Amazon is the world's largest marketplace, with a projected gross merchandise value (GMV) of US$757 billion in 2024. This figure includes transactions across all 22 domains Amazon around the world.
If you're considering getting into eCommerce on Amazon but haven't decided what to sell, how do you choose the right product? And where to sell it? One effective approach is to use ECDB data, which provides statistics on the best-selling product segments on Amazon. You can also find out which country is the best choice for your product. Here's how to use this data to make an informed decision.
Amazon in Numbers:
Sales Statistics and Trends
Overall, Amazon’s marketplaces generated a total GMV of around US$728.8 billion in 2023. A large portion of these sales, around 65.9%, came from third-party sellers: Independent businesses that sell their products on Amazon's platform. To be succesful, its mandatory to focus on the regions and categories that show the most promise. But how do I find the best market for my product? ECDB can help with that.
Amazon’s Top Stores in Terms of Growth, Sales & Average Order Value
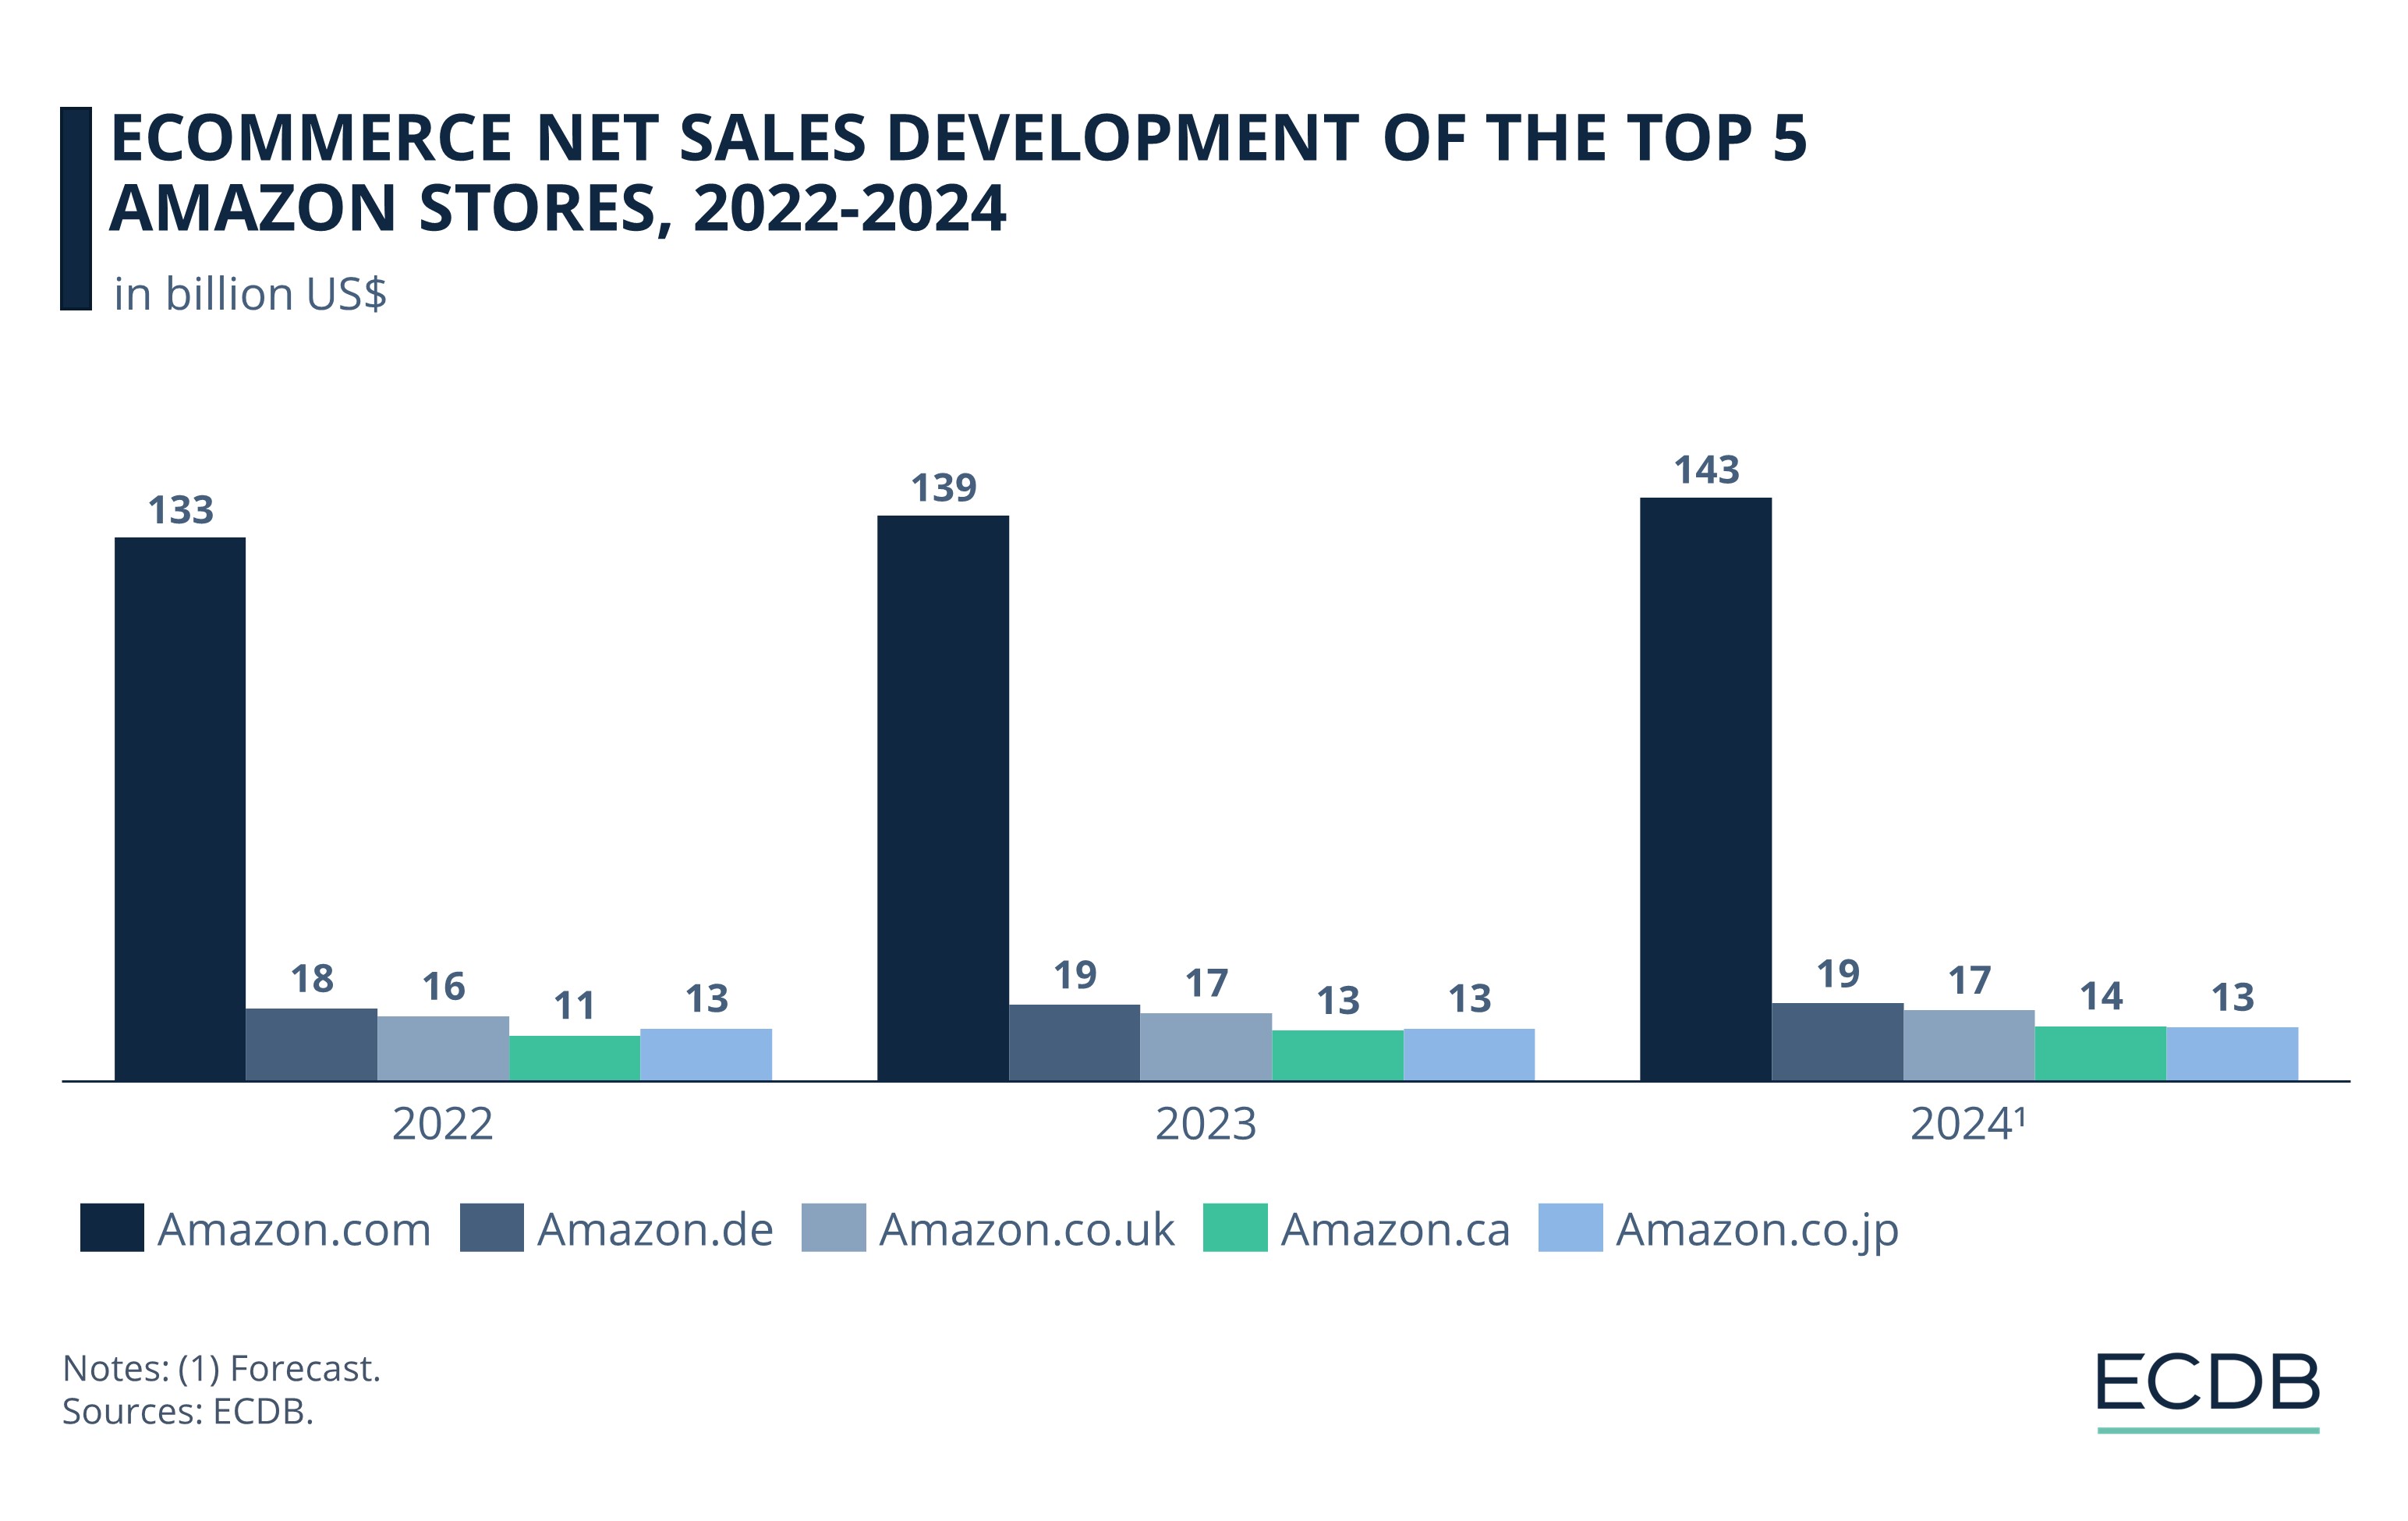
If you're thinking about selling on Amazon, it's important to look at where the most growth is happening. Based on data from ECDB, the most popular Amazon sites were amazon.com, amazon.co.jp, amazon.co.uk, amazon.de, and amazon.ca, each contributing significantly to Amazon's global presence. Amazon.ca, the Canadian site, is currently the fastest-growing among the top 5 largest Amazon markets by GMV, making it an attractive option for new sellers.
The growth rates from 2022 to 2023 for these markets varied, with Canada leading at +11.3%, followed by Germany at +5.4%, the United Kingdom at +5.3%, and Japan at a slower pace of +0.5%. In these regions, the main sales categories also differed: Electronics dominated in Germany, while Hobby & Leisure was the top category in the UK, Japan, and Canada.
When examining net sales, Germany led with US$18.7 billion, followed by the UK with US$16.7 billion, Japan with US$12.9 billion, and Canada with US$12.5 billion. The conversion rates (the percentage of visitors who make a purchase) also varied, with the UK having the highest at 2.5%, followed by Germany at 2.1%, Canada at 1.8%, and Japan at 1.4%. Average order values were highest in Japan at US$97, followed by Canada at US$91, Germany at US$88, and the UK at US$61.
These figures highlight where the best opportunities might lie for new sellers. Amazon.ca, with its higher growth rate and average order value, presents a significant opportunity for sellers looking to tap into a rapidly expanding market. Additionally, understanding the dominant product categories in each region can help sellers strategically choose what to offer.
Checking Target Market Product Categories With ECDB
Further examination of the Canadian Amazon store reveals that the two largest product categories are Electronics and Hobby Products, which together account for nearly 74.5% of total sales. Offering a product in one of these categories could therefore be a wise choice. In contrast, fashion products account for only 5.2% of the market, suggesting that Canadians rarely shop for fashion on Amazon. Similarly, groceries are not a popular category, accounting for only 2.2% of total sales. However, it's important to consider factors beyond market demand, such as margins. Margins on Amazon can be quite high, so it is also wise to assess the competition.
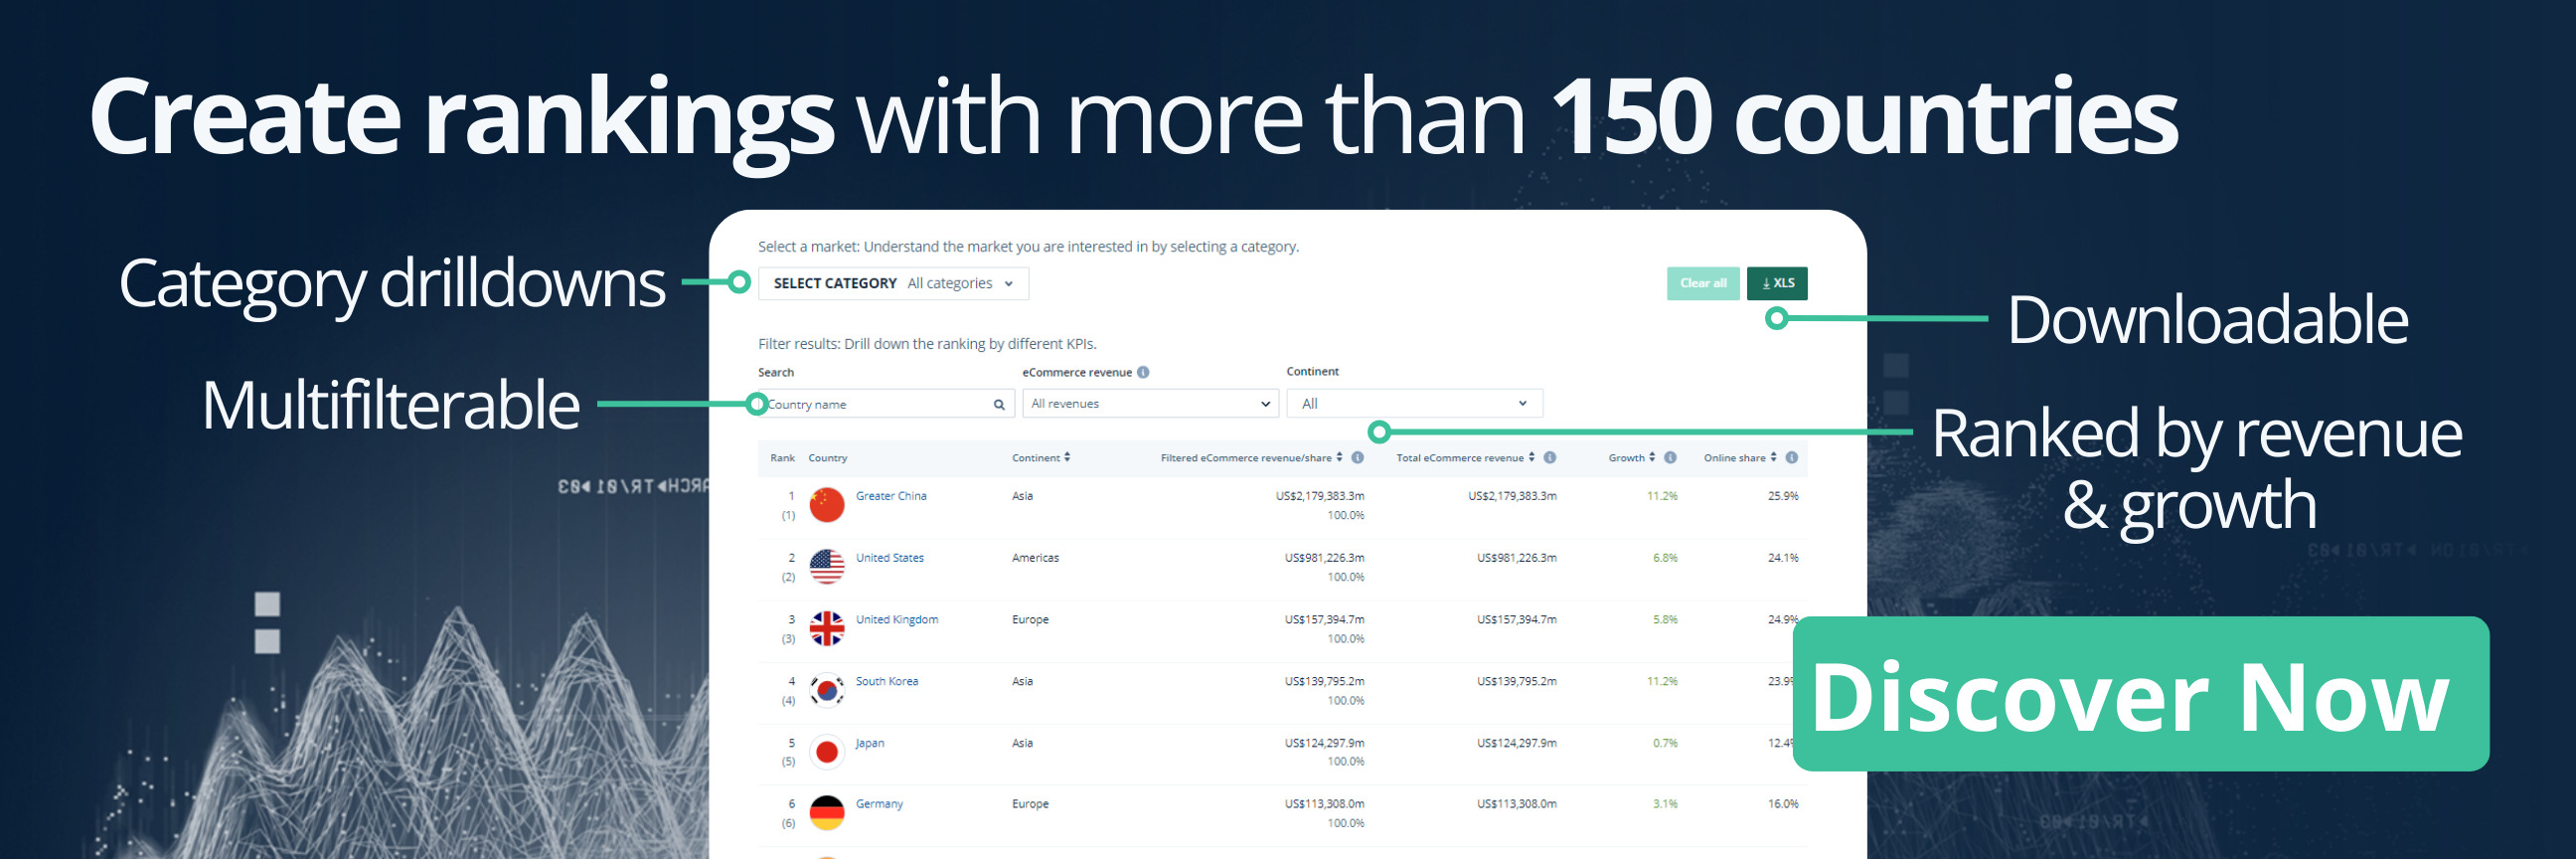
Stay Informed: Our rankings are continuously updated with the newest data from our models, offering valuable insights to enhance your business strategy. Curious about which stores and companies are at the forefront of eCommerce? Want to know which categories are leading in sales and popularity? Discover the answers in our rankings for companies, stores, and marketplaces. Keep ahead of the competition with ECDB.
Know Your Competition
Maybe Amazon isn't the best platform to sell your product, or perhaps you should consider selling on Amazon alongside some of its competitors. One of the biggest competitors to Amazon in Canada is BestBuy.ca. BestBuy experienced a significant decline in 2023, with sales dropping by 5.7%. The platform focuses on electronics, has a slightly higher average order value (US$92), and a lower conversion rate compared to Amazon. Given these factors, it could be beneficial to offer your product on BestBuy.ca as well. Using the ECDB comparison tool, you can analyze various online stores worldwide and access valuable data to make informed decisions.
Click here for
more relevant insights from
our partner Mastercard.
Related insights
Deep Dive
eCommerce in Canada: Top Stores, Market Development & Trends
eCommerce in Canada: Top Stores, Market Development & Trends
Deep Dive
Top Online Stores in Europe: Amazon Accounts for 40% of Top 20's Sales
Top Online Stores in Europe: Amazon Accounts for 40% of Top 20's Sales
Deep Dive
Top eCommerce Companies by Market Cap 2024
Top eCommerce Companies by Market Cap 2024
Deep Dive
Online Shopping in the United States: Where Consumers Prefer to Shop Online
Online Shopping in the United States: Where Consumers Prefer to Shop Online
Deep Dive
Alibaba Competitors: Which Companies Are Alibaba’s Biggest eCommerce Rivals?
Alibaba Competitors: Which Companies Are Alibaba’s Biggest eCommerce Rivals?
Back to main topics