Amazon Prime Day 2023: How Much Did Consumers Spend This Year?
Download
Coming soon
Share
Prime Day 2023: Key Insights
Amazon Prime Day 2023 saw a rise in sales, hitting an estimated global total of US$20.5 billion. This suggests a positive trajectory for Amazon's retail operations despite current inflationary pressures.
The average order value and household spending increased, but consumers gravitated towards a higher number of lower-priced items.
Buy Now Pay Later (BNPL) options are gaining traction, accounting for 6.5% of orders in 2023, which indicates a shift in consumer payment preferences and opportunities for payment service providers.
Amazon Prime Day is when shoppers around the world visit their favorite eCommerce retailer to get discounts on products across a variety of categories. This year’s event, which took place on July 11 and 12, is said to have generated record-breaking sales. Here are the details.
Despite the war in Ukraine and global inflation, Andy Jassy (CEO of Amazon) managed to achieve a massive success – again. According to Amazon, more than 375 million items were sold on these two shopping days, and consumers saved US$2.5 billion on their purchases. Following up on our analysis prior to Prime Day 2023, we provide you with a more detailed analysis of how this popular shopping event played out.
Over US$20 Billion Sold on Prime Day 2023
In our insight into the aftermath of last year’s Prime Day, we presented the development of Prime Day sales since the start of the event in 2015. Since then, there has been a steady upward trend in sales, according to third-party estimates on the subject. However, since Amazon does not publish much concrete data to measure the exact volume of Prime Day sales, we made some projections.
According to Adobe’s analysis, this year’s Prime Day sales reached US$12.7 billion in the United States alone, representing 6.1% nominal growth over the previous year. If the U.S. share of sales remains the same as in previous years, we expect global sales to be approximately US$20.5 billion in 2023, up from US$19.2 billion in 2022.
A brief economic digression: When we say that revenues increased by 6%, we're talking about nominal growth, which does not take into account the impact of inflation. If the inflation rate is also 6%, then the real growth rate (i.e., growth after adjusting for inflation) would be approximately 0%.
Despite all, considering that this year’s economic climate is still characterized by challenges related to inflationary pressures, this positive development in Prime Day sales can be seen as a notable success for Amazon.
Speaking of purchasing amidst inflation, how did this year’s spending patterns compare to last year’s? Let’s take a look.
Shoppers Spent About US$2 More per Order Since 2022
Based on Numerator verified buyer surveys, we can estimate how shopping behavior has evolved since Prime Day 2022. Looking at the average order value placed by consumers on Prime Day 2023, there was a slight increase in higher-priced orders over US$50 compared to 2022.
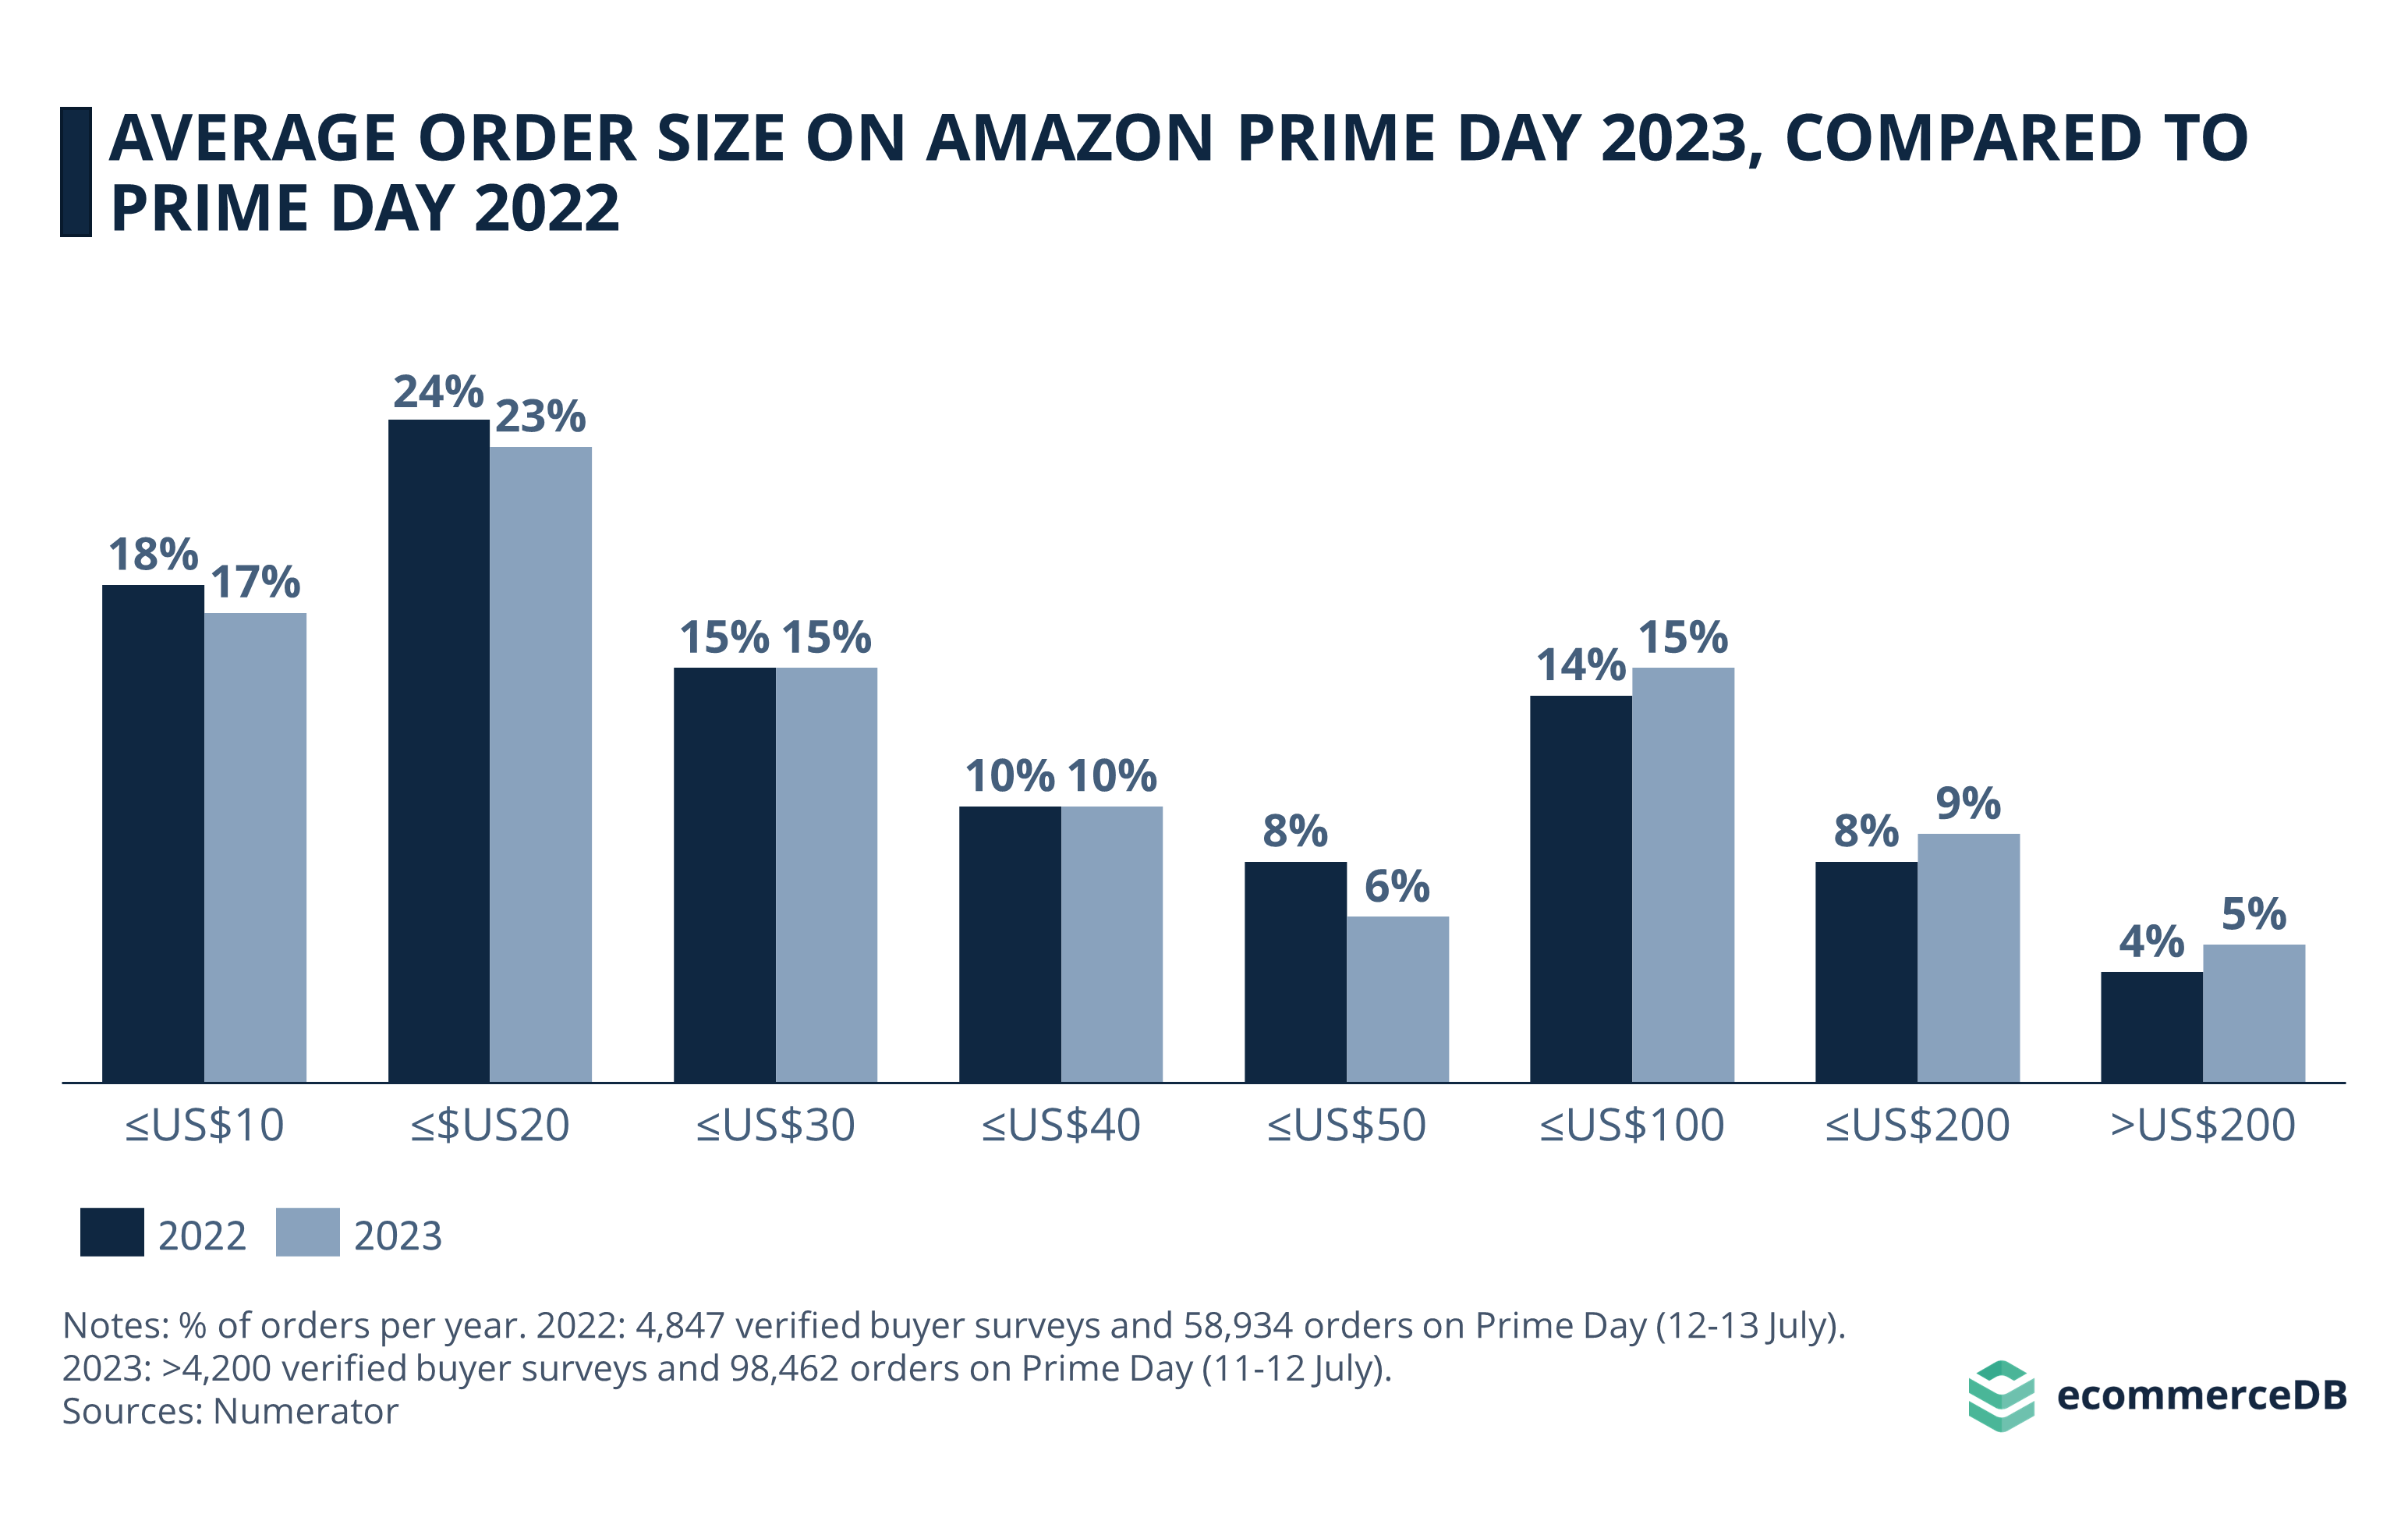
Overall, 29% of orders in 2023 were greater than US$50, compared to 26% in 2022. Similarly, 71% of orders placed on Prime Day 2023 were US$50 or less, compared to 75% of orders in 2022.
This tells us that, on average, shoppers spent more on their Prime Day orders, which is reflected in the average order size of US$54.05, about US$2 more than last year’s average (US$52.26).
Average Household Spend Was US$155.67 on Prime Day 2023
A similar finding applies to average household spending in 2023, which leaned towards higher spending than last year. This year, 46% of households spent more than US$100, a slight increase from 2022’s 41%.
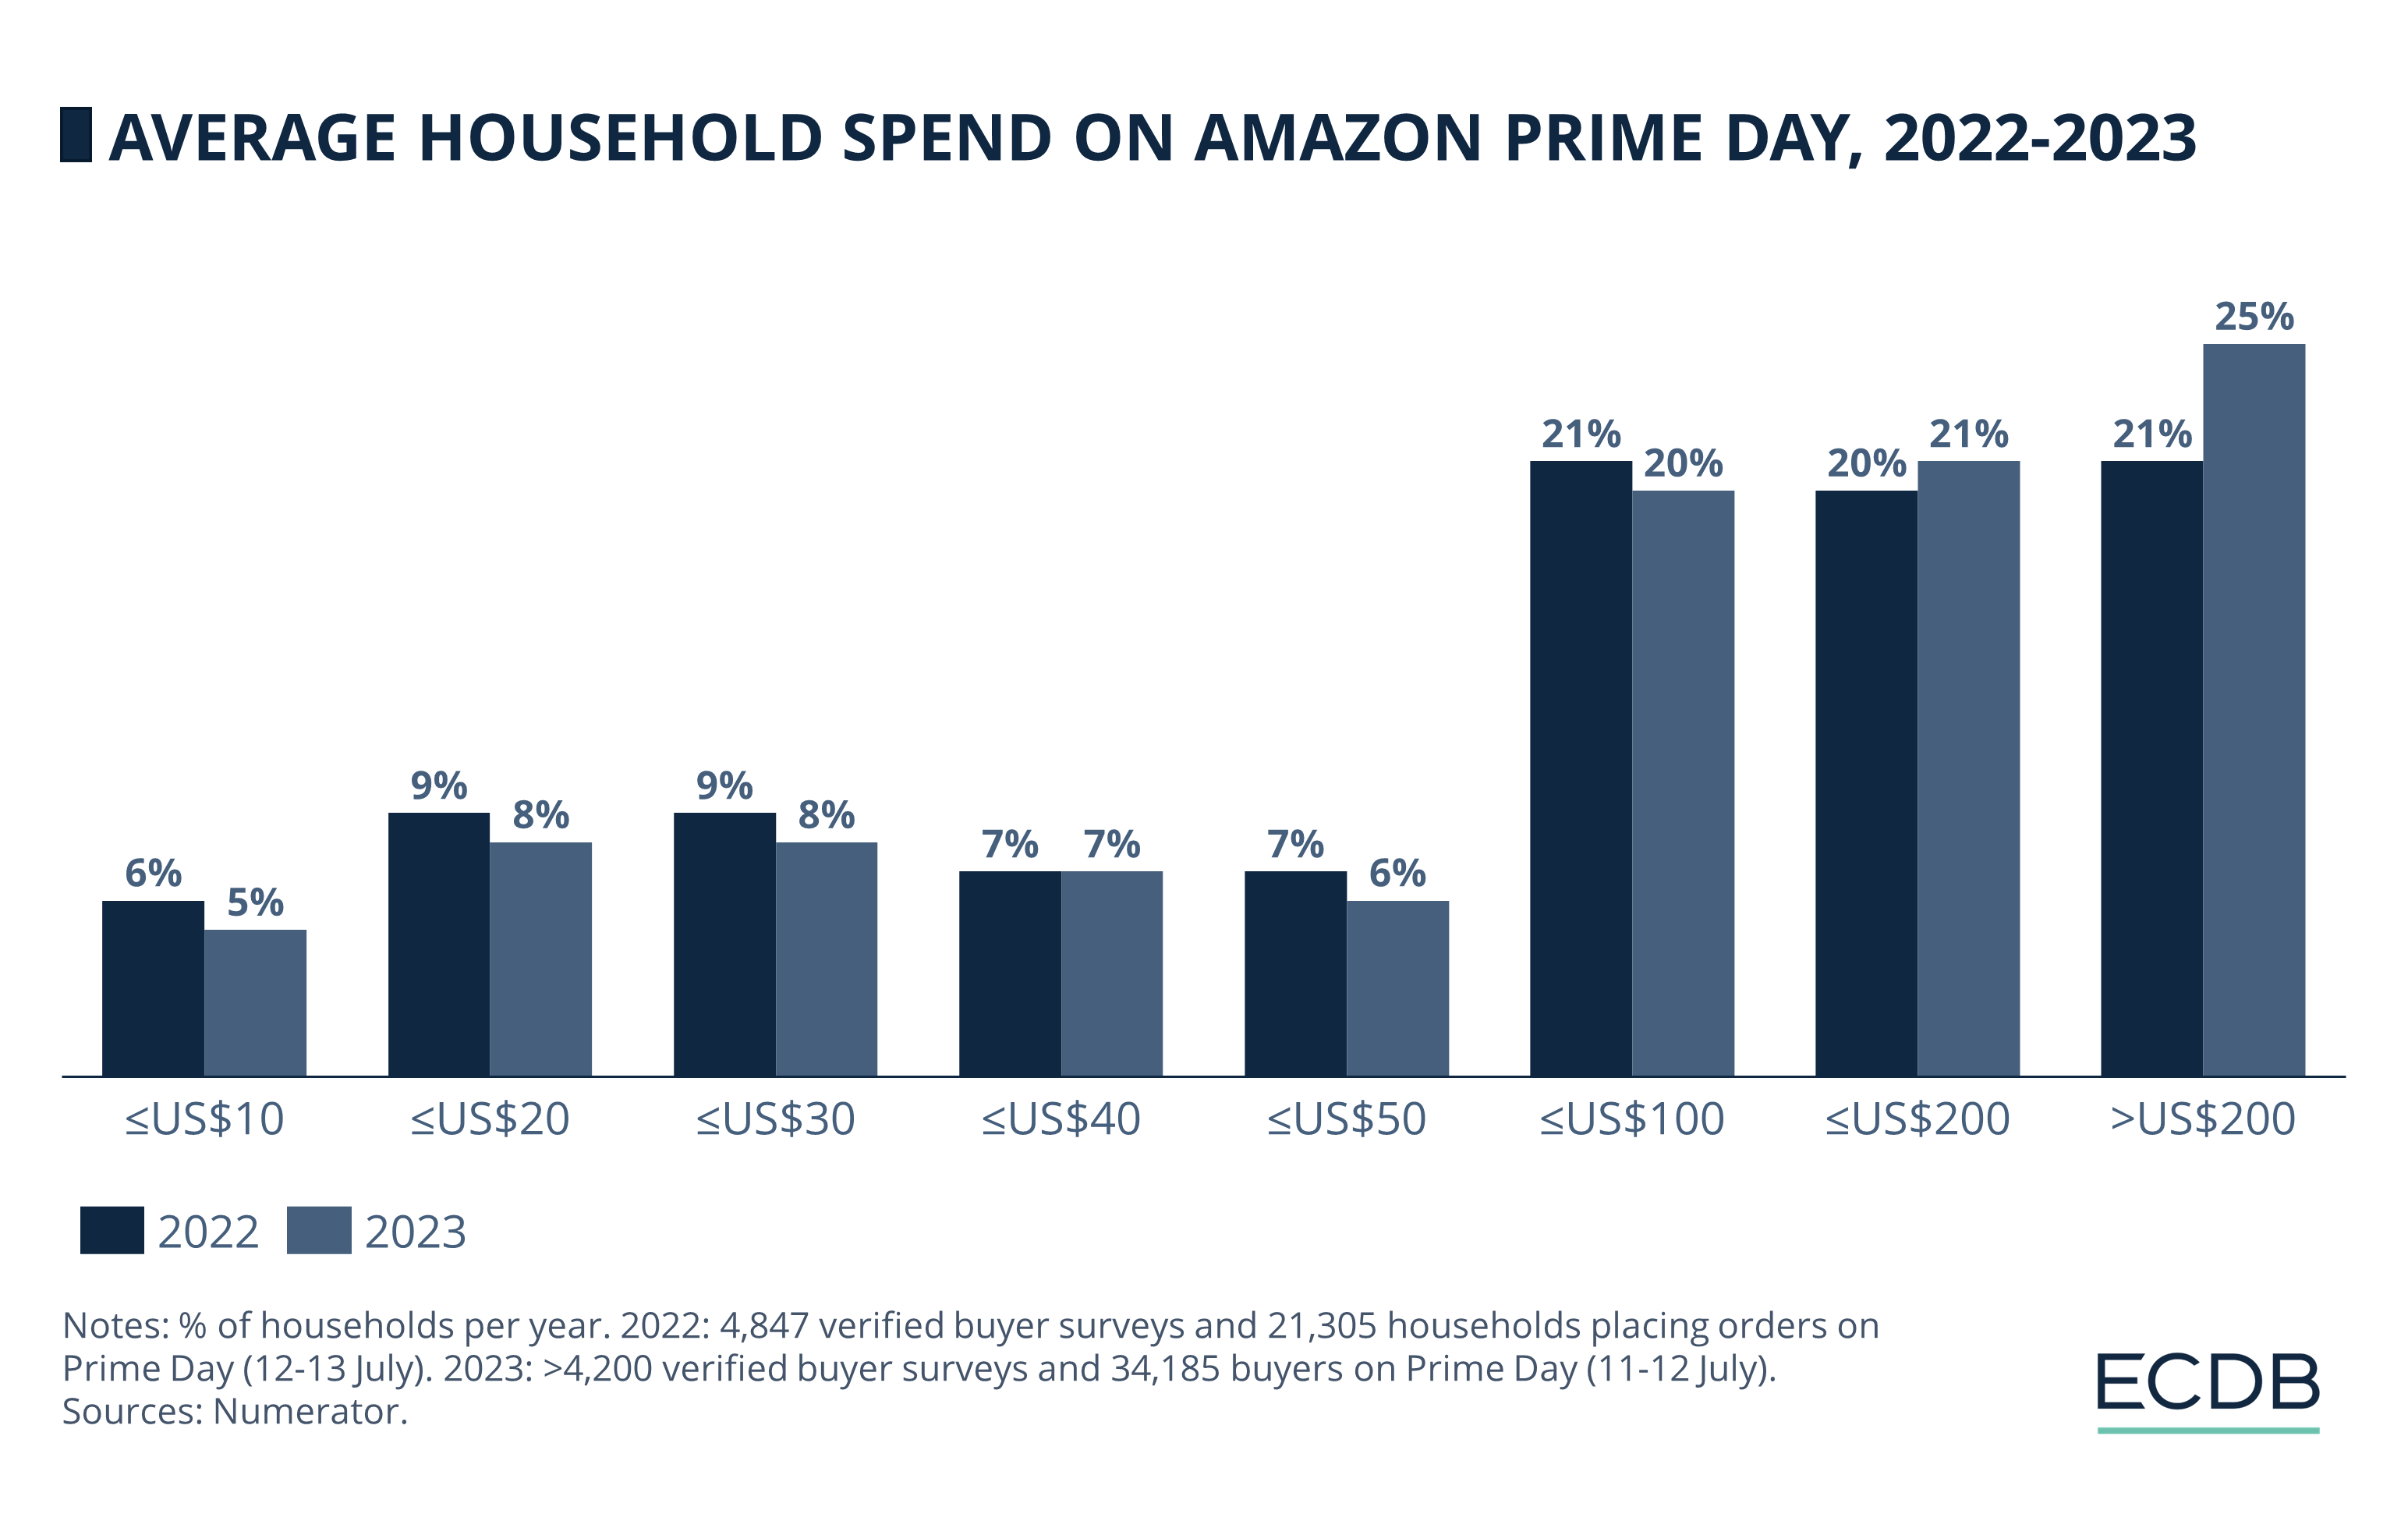
On average, households purchased a total of US$155.67 in 2023, which is about US$11 more than in 2022.
The price per item sold, which is examined in the next subsection, provides us with more details about shopping behavior on this year’s Prime Day.
Consumers Bought Lower-Priced Items on This Year's Event
Despite the modest increase in average order value and household spend since 2022, the average price per item sold shows us that consumers were not necessarily buying more expensive products – they were buying more of them.
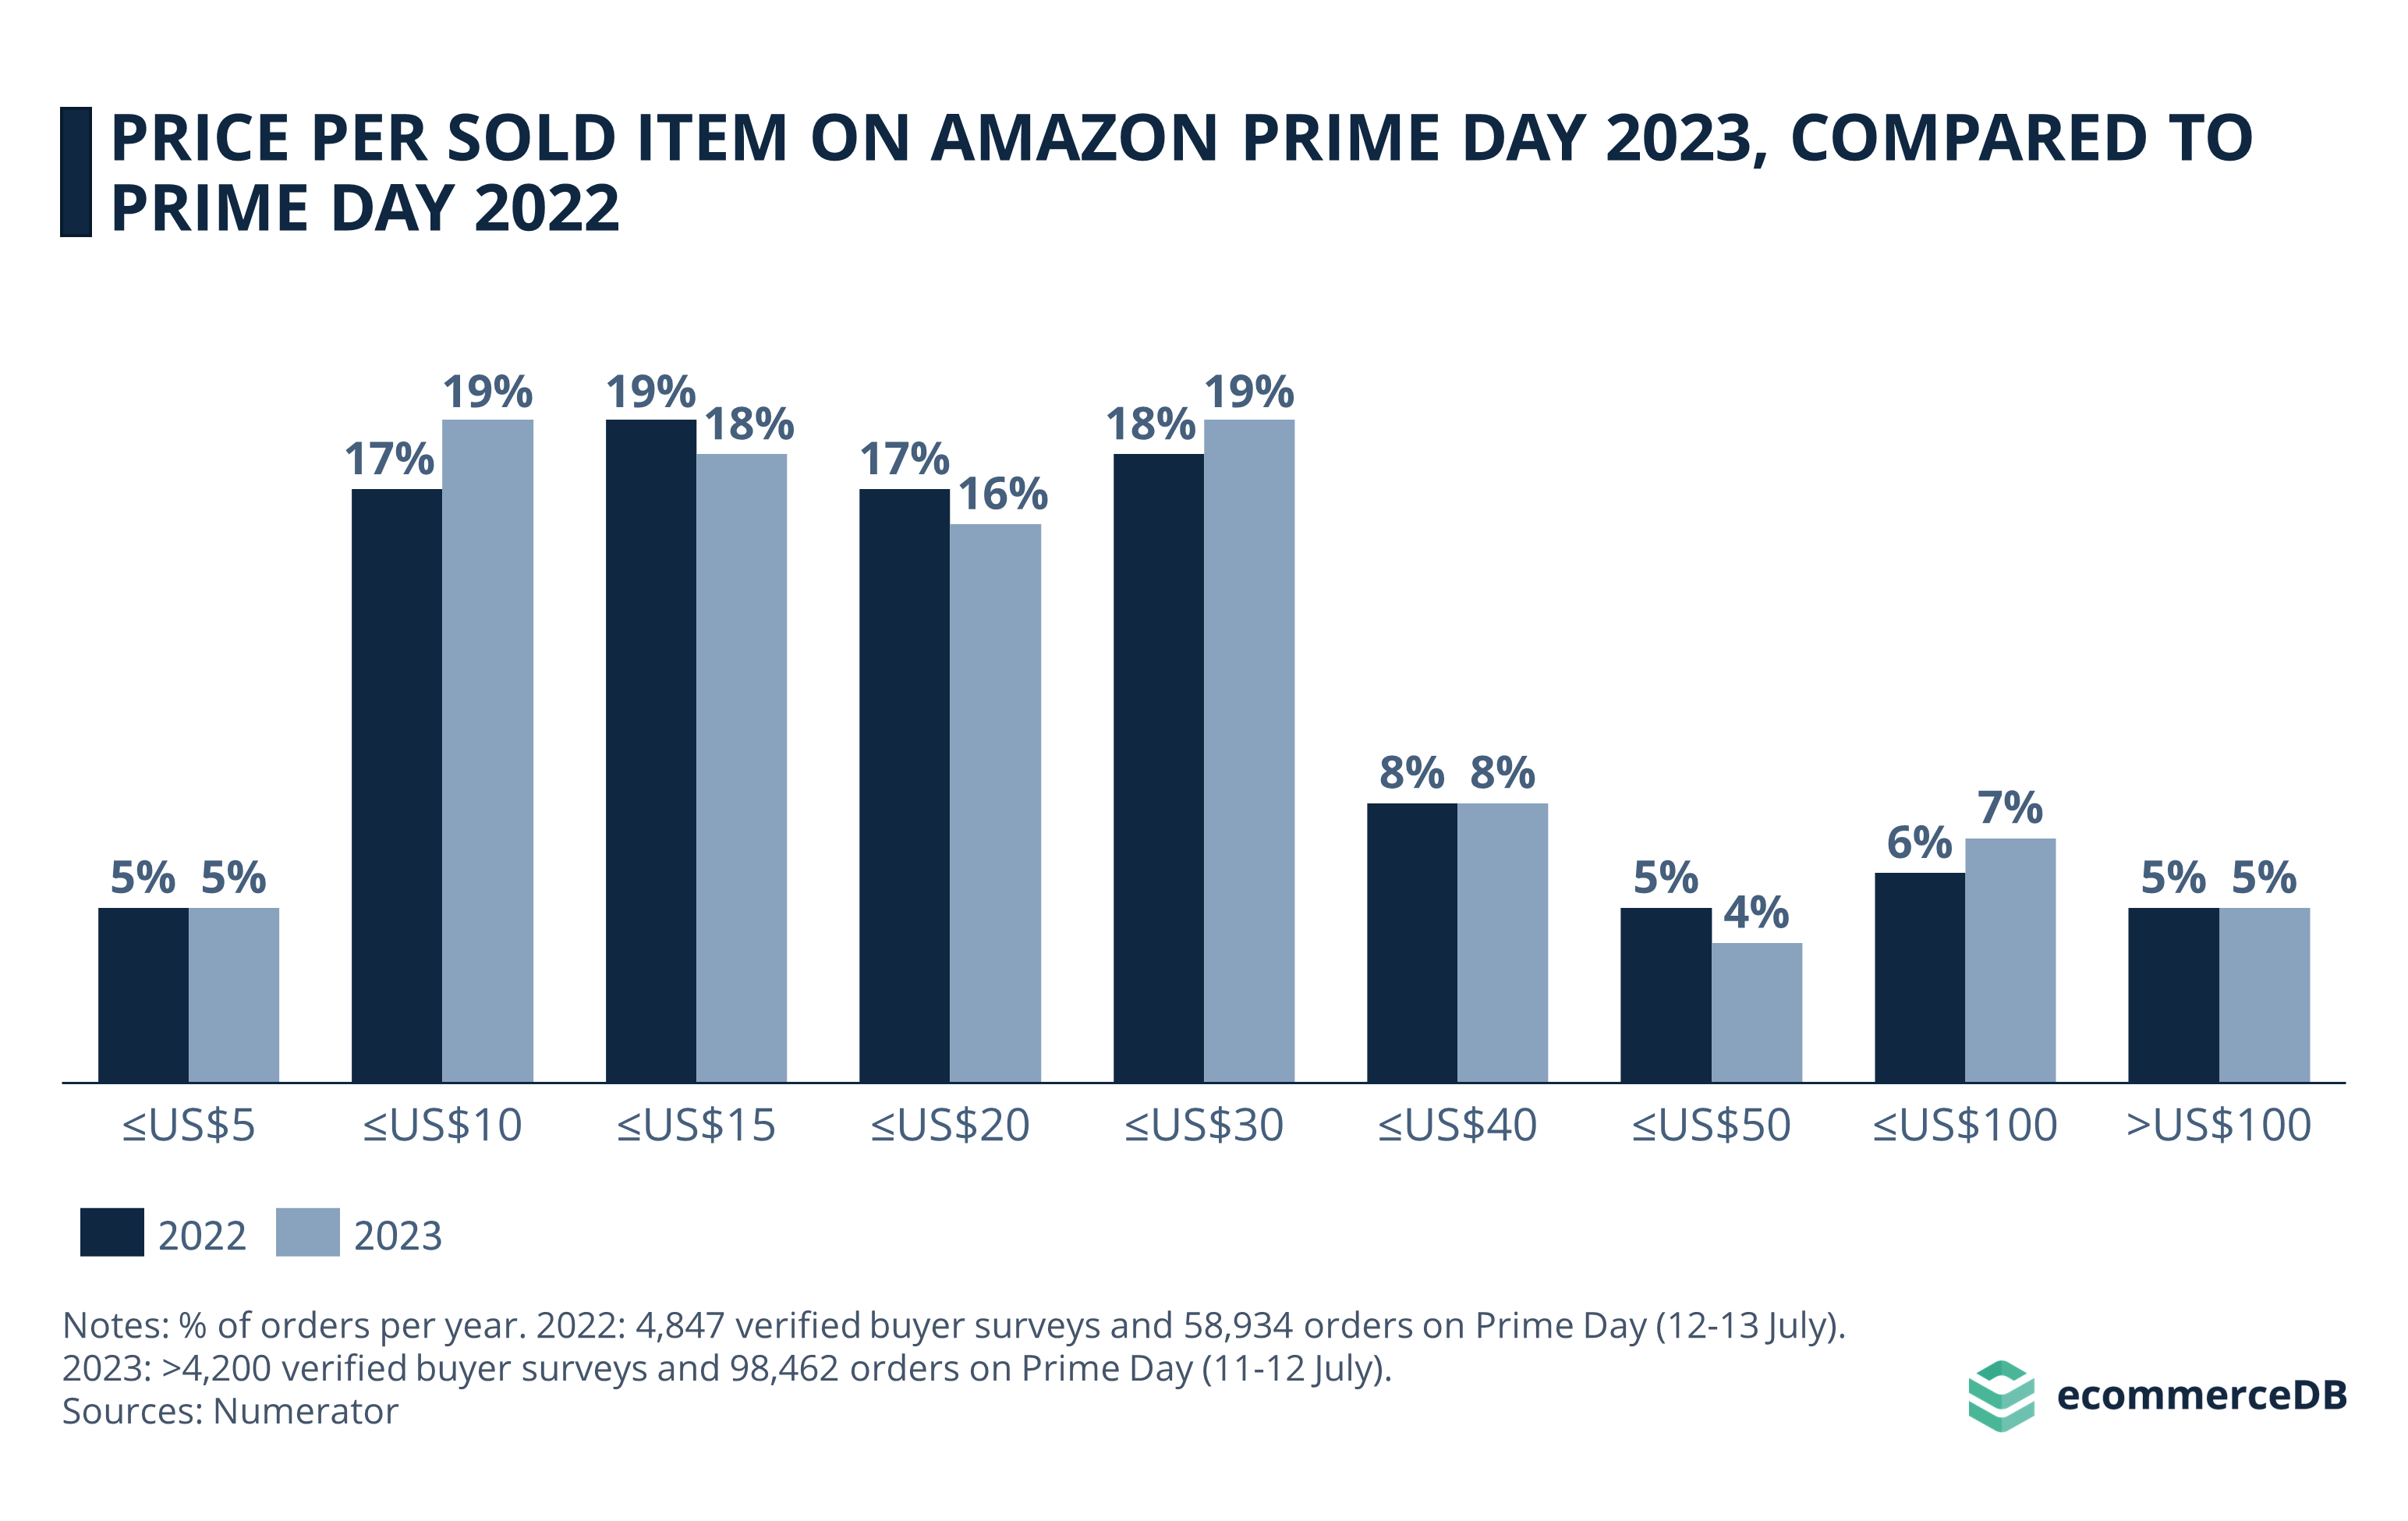
77% of items purchased in 2023 cost US$30 or less, a slight increase from 2022 when 76% were in this range. The average price per item sold dropped accordingly, costing US$32.35 in 2023, more than US$1 less than the 2022 figure of US$33.58.
Shoppers on Average Bought More Items at Lower Prices, Supported by Installment Payments
While these are only small variations, the results allow us to conclude that Prime members, on average, bought more items at lower prices, increasing total household spending compared to 2022. This is still beneficial for Amazon and the retailers who sell their products on the site, as it makes consumers feel as though they have truly benefited from the discounts, leading them to buy more, which in turn increases sales and profits for the merchants.
Higher household consumption and increased order values may have been further facilitated by Buy Now Pay Later (BNPL) payment options, which were used for 6.5% of orders on both Prime Days in 2023. Accounting for US$927 million in revenue, BNPL payments increased 20% year-over-year, benefiting retailers, BNPL providers, and consumers who were able to buy more items using this installment payment option.
But which products were the most popular this Prime Day? The top 10 categories give us an idea.
Home Utilities Were Most Commonly Bought in 2023
Goods used in and around the home, such as cleaning products took the top spot, with 28% of buyers having made purchases in this category. Household Essentials (26%) and Fashion (24%) follow in second and third place, respectively.
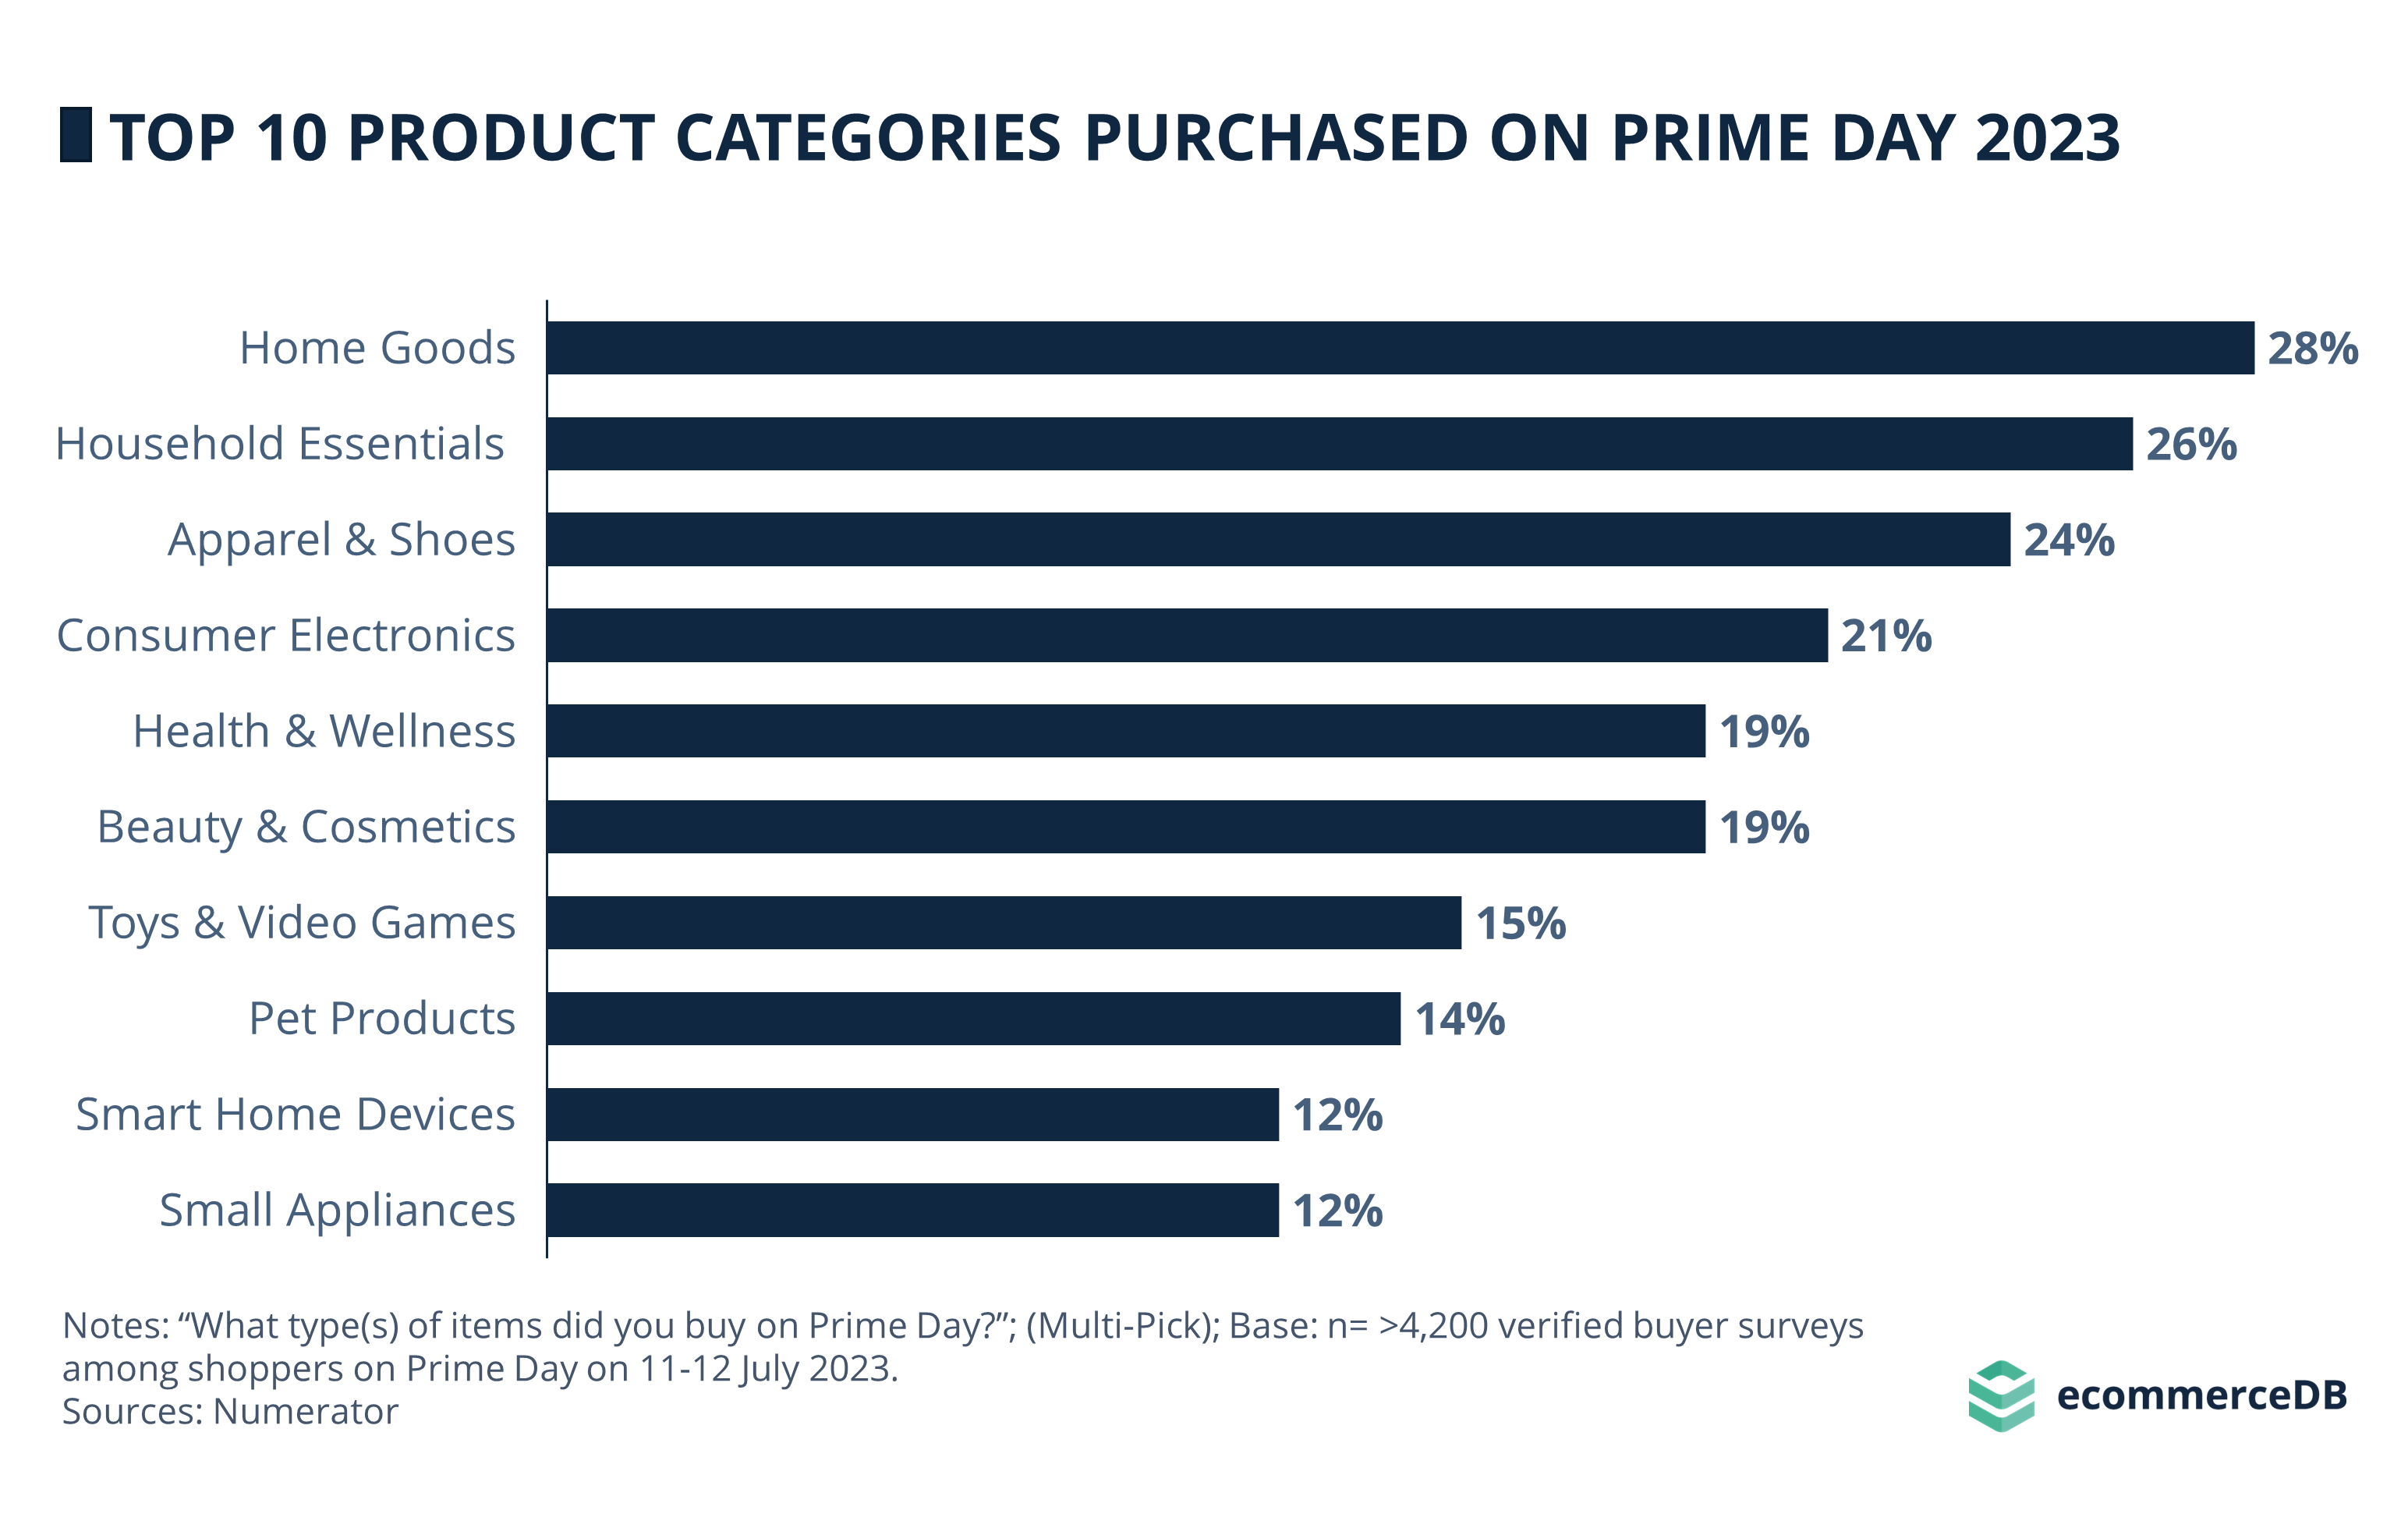
While Consumer Electronics ranked third last year, this category was purchased less in 2023 and ranked fourth. Health and Beauty share fifth place with 19% of respondents each. Meanwhile, Toys & Video Games, Pet Products, Smart Home Devices and Small Appliances rank 6th through 9th. It is noteworthy that Smart Home Devices has experienced a notable decline since 2022, which could be due to demand saturation as consumers do not need to buy a new device every year.
On the Whole
Amazon’s Prime Day 2023 achieved record sales, with over 375 million items sold. U.S. sales reached an estimated US$12.7 billion, marking a 6.1% growth from last year, and we estimated total global sales at approximately US$20.5 billion.
Interestingly, shoppers increased their expenditures per order and total household spending, all the while opting for more items that were lower in price, with 77% of purchased items costing US$30 or less.
Increased usage of BNPL payment options was also noted. The most popular product categories included Home Goods, Household Essentials, and Fashion.
Click here for
more relevant insights from
our partner Mastercard.
Related insights
Deep Dive
eCommerce in Canada: Top Stores, Market Development & Trends
eCommerce in Canada: Top Stores, Market Development & Trends
Deep Dive
Top eCommerce Companies by Market Cap 2024
Top eCommerce Companies by Market Cap 2024
Deep Dive
Online Shopping in the United States: Where Consumers Prefer to Shop Online
Online Shopping in the United States: Where Consumers Prefer to Shop Online
Deep Dive
Alibaba Competitors: Which Companies Are Alibaba’s Biggest eCommerce Rivals?
Alibaba Competitors: Which Companies Are Alibaba’s Biggest eCommerce Rivals?
Deep Dive
The Global B2B eCommerce Market: Why It Is Beneficial to Sell to Other Businesses
The Global B2B eCommerce Market: Why It Is Beneficial to Sell to Other Businesses
Back to main topics