eCommerce: Buy Now Pay Later
Buy Now, Pay Later (BNPL) in the U.S: Top Providers, Market Analysis & Consumer Behavior
"Buy Now, Pay Later" (BNPL) is becoming increasingly popular in the U.S. What are the top providers in the country and who uses these platforms? Based on survey results, we provide fact-based results.
Article by Cihan Uzunoglu | July 04, 2024Download
Coming soon
Share
Buy Now, Pay Later (BNPL) in the United States:
Key Insights
Top BNPL Providers:
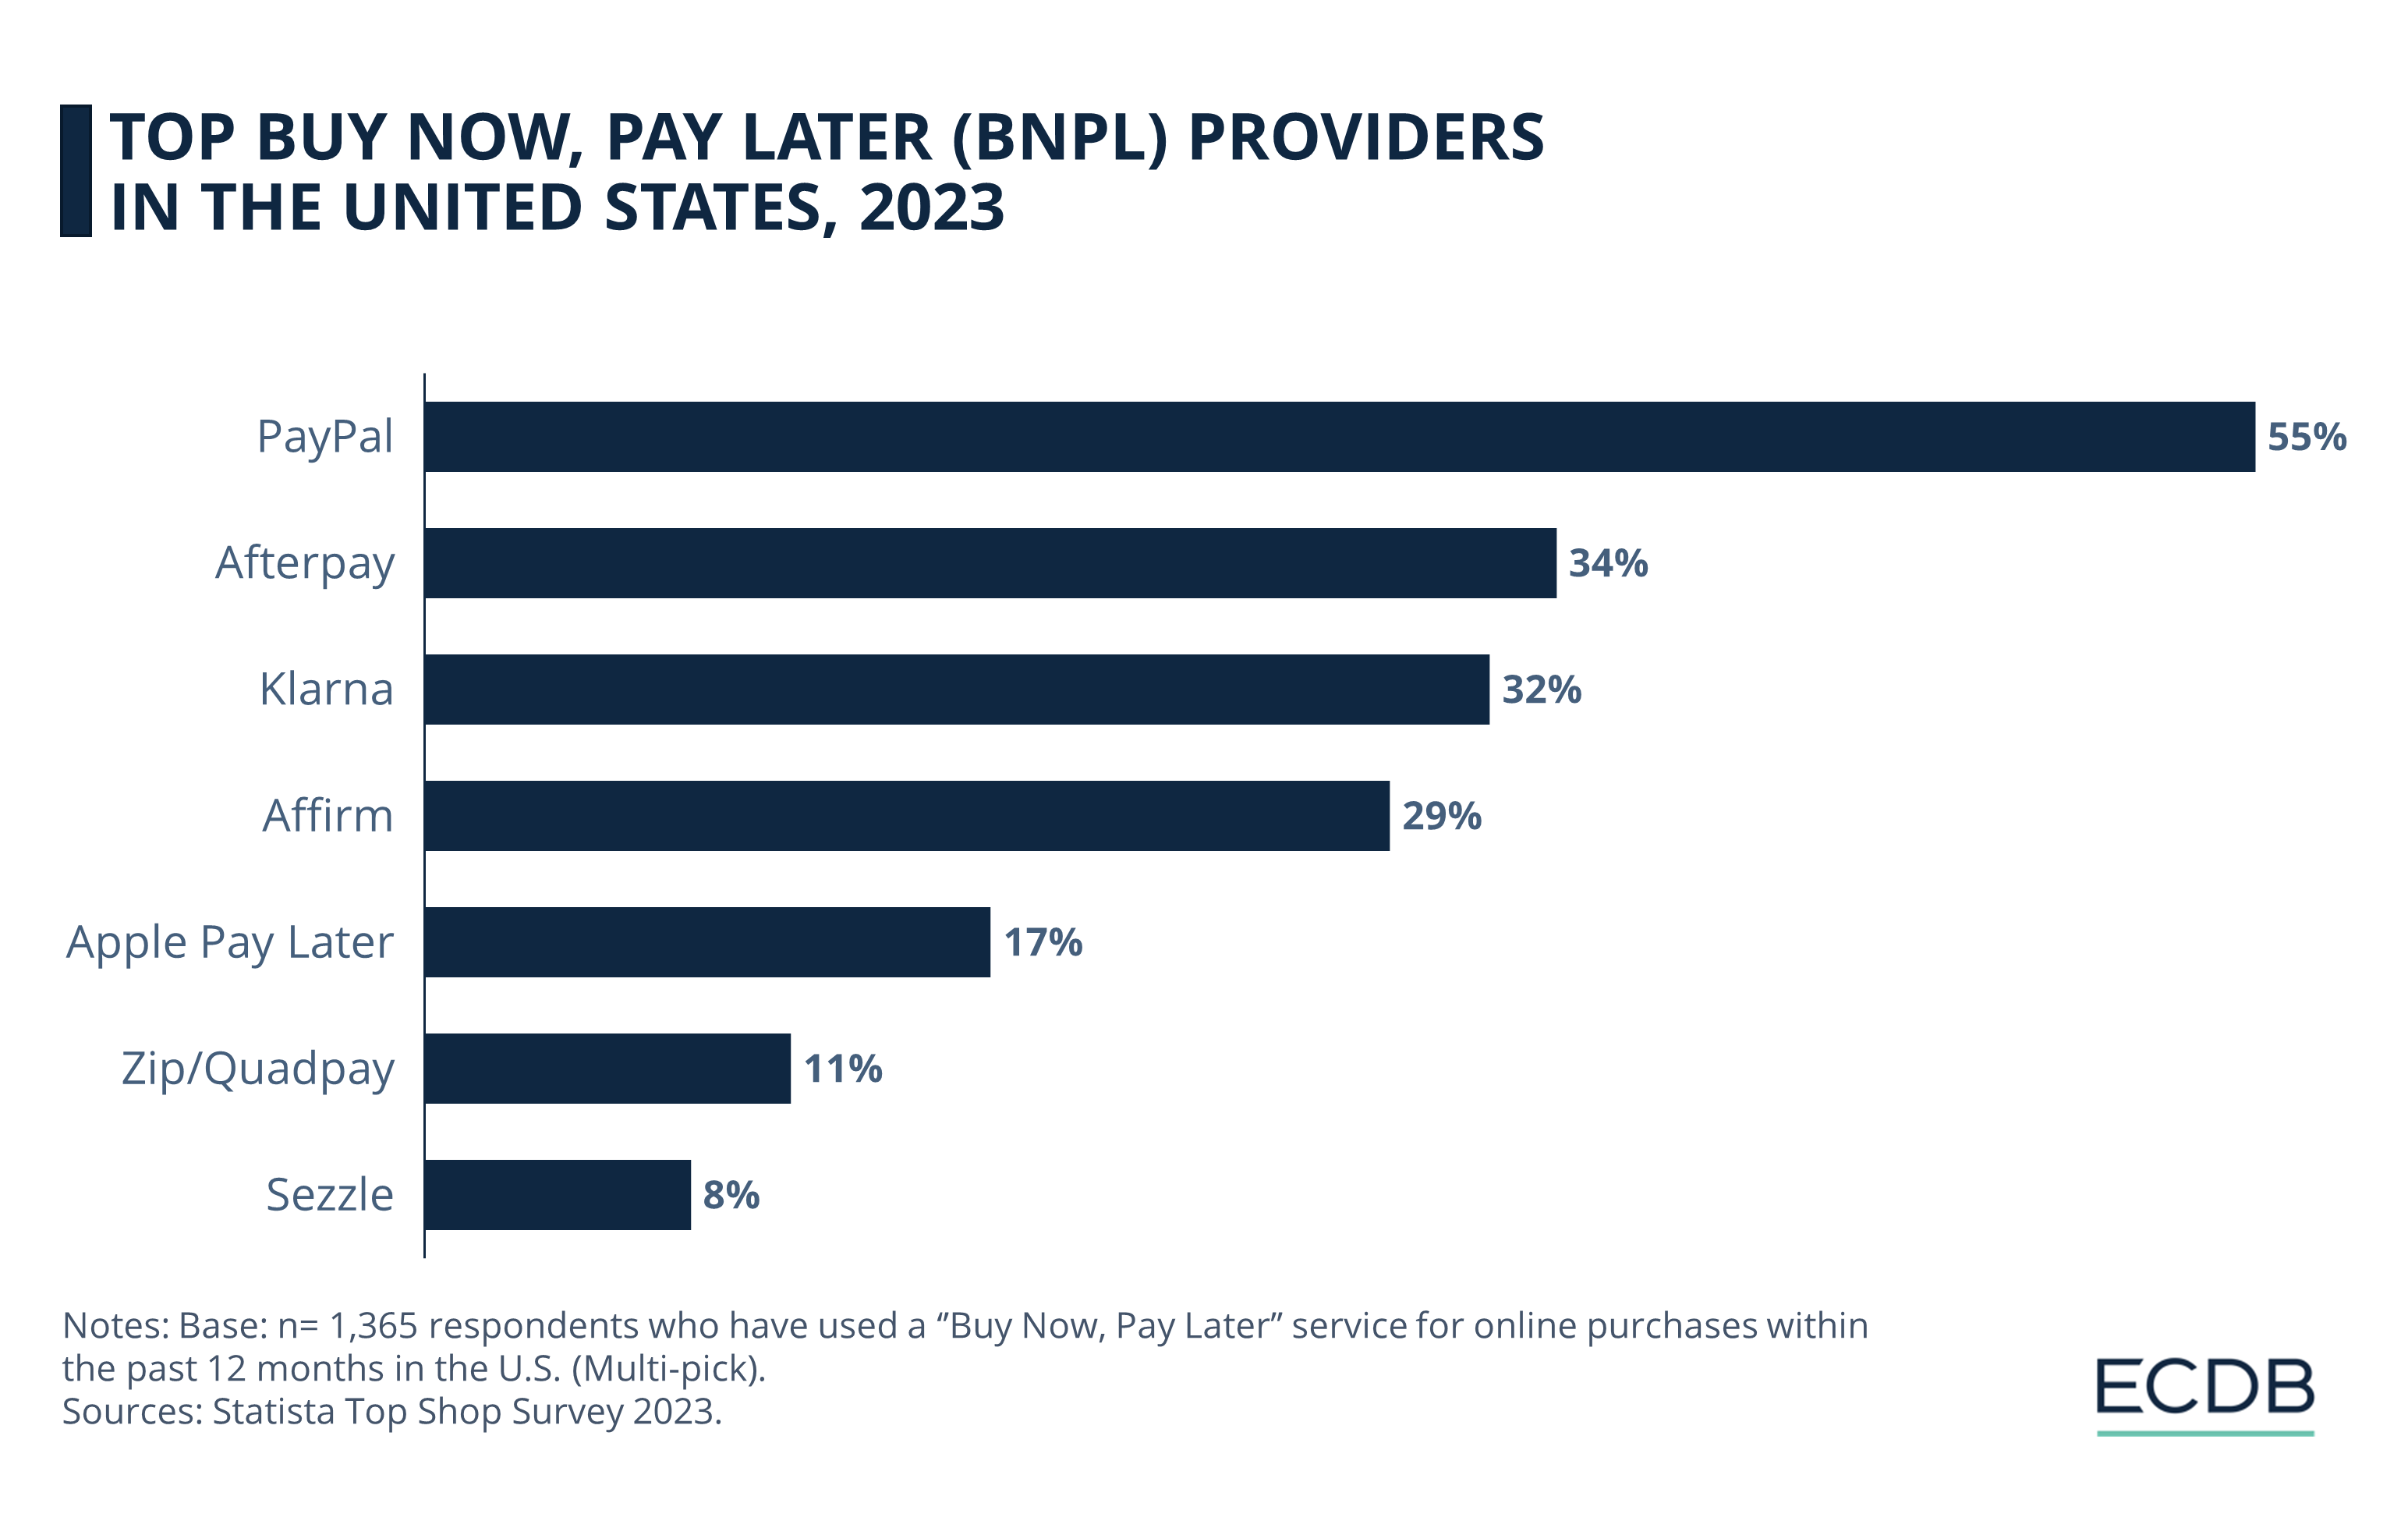
PayPal leads the U.S. BNPL market with 55% usage due to high trust, followed by Afterpay at 34%. While Klarna is popular in mid-sized cities at 32%, Affirm is preferred in smaller cities at 29%. Apple Pay Later captured 17% before it was discontinued, and Zip with 11% is preferred in larger cities. Sezzle with 8% is known for its gender-neutral appeal.
BNPL User Demographics:
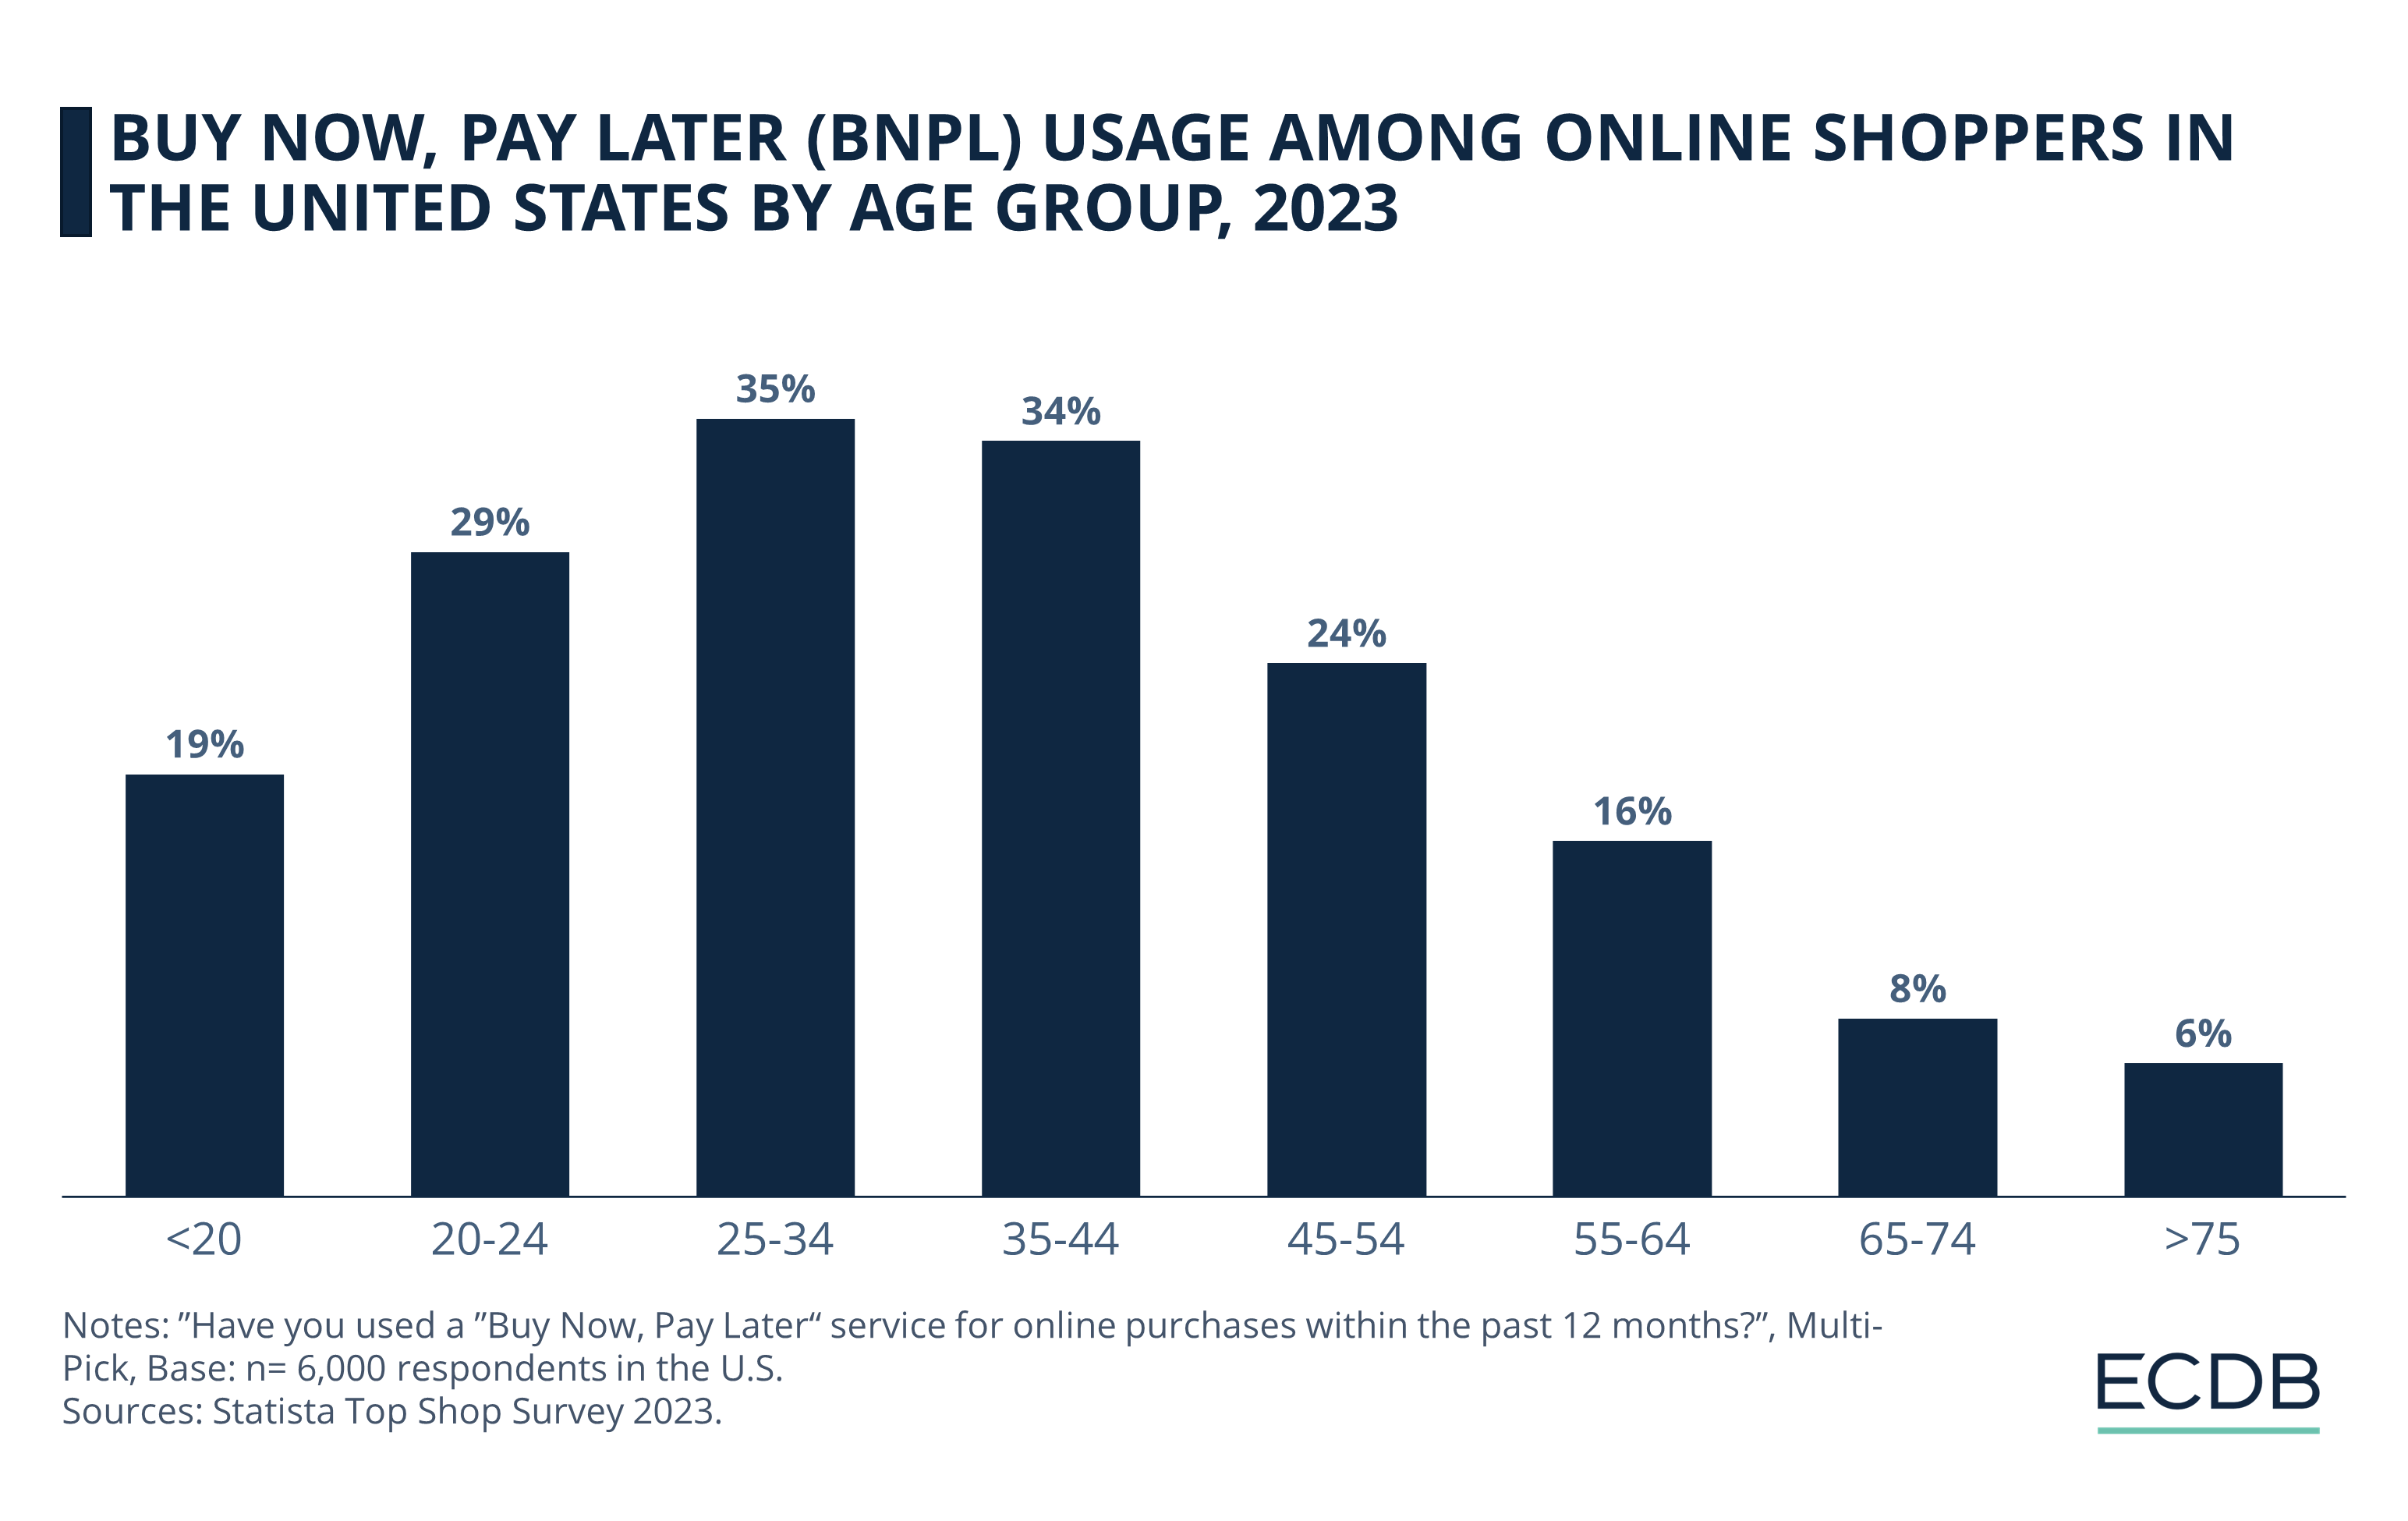
Almost a quarter of U.S. online shoppers have used BNPL in the past 24 months, with the highest usage among those aged 25-44, males, residents of larger cities, and individuals from larger households.
Reasons for BNPL Use:
60% of U.S. BNPL shoppers use the service for flexibility in installment payments, 38% because they couldn't afford the product otherwise, and 37% due to lower interest rates compared to credit cards, with variations in reasons influenced by gender, age, income level, household size, and city size.
The “Buy Now Pay Later (BNPL)” option has reshaped shopping habits, especially during the pandemic. It allows consumers to split purchases into installments, often interest-free. The approach is straightforward: pay a portion upfront, then pay the rest over time.
To further explore this trend and understand how BNPL is shaping consumer spending, in collaboration with Statista, we asked consumers in the U.S. about their BNPL habits to assess the current state of this payment method.
Before diving into the most popular BNPL provider in the United States, let's get our definition straight.
What is Buy Now, Pay Later (BNPL)?
Buy Now, Pay Later (BNPL) is a financing option that allows consumers to make purchases and pay for them over time, typically in interest-free installments. This flexible payment method has gained popularity for its ease of use: shoppers pay an initial amount at checkout and spread the remaining balance over several payments.
BNPL is often integrated directly into online checkout processes, making it a convenient choice for managing cash flow and avoiding credit card interest. It appeals to a wide range of consumers, enhancing affordability and enabling more strategic financial planning.
Top BNPL Providers in the United States
Based on the survey results, here are the top BNPL providers in the United States:
PayPal (55%)
Afterpay (34%)
Klarna (32%)
Affirm (29%)
Apple Pay Later (17%)
Zip (11%)
Sezzle (8%)
1. PayPal
PayPal leads as the most popular choice among surveyed users, with more than half (55%) opting for it. The company’s strong market presence, as well as the high level of trust and familiarity among consumers are factors contributing to this.
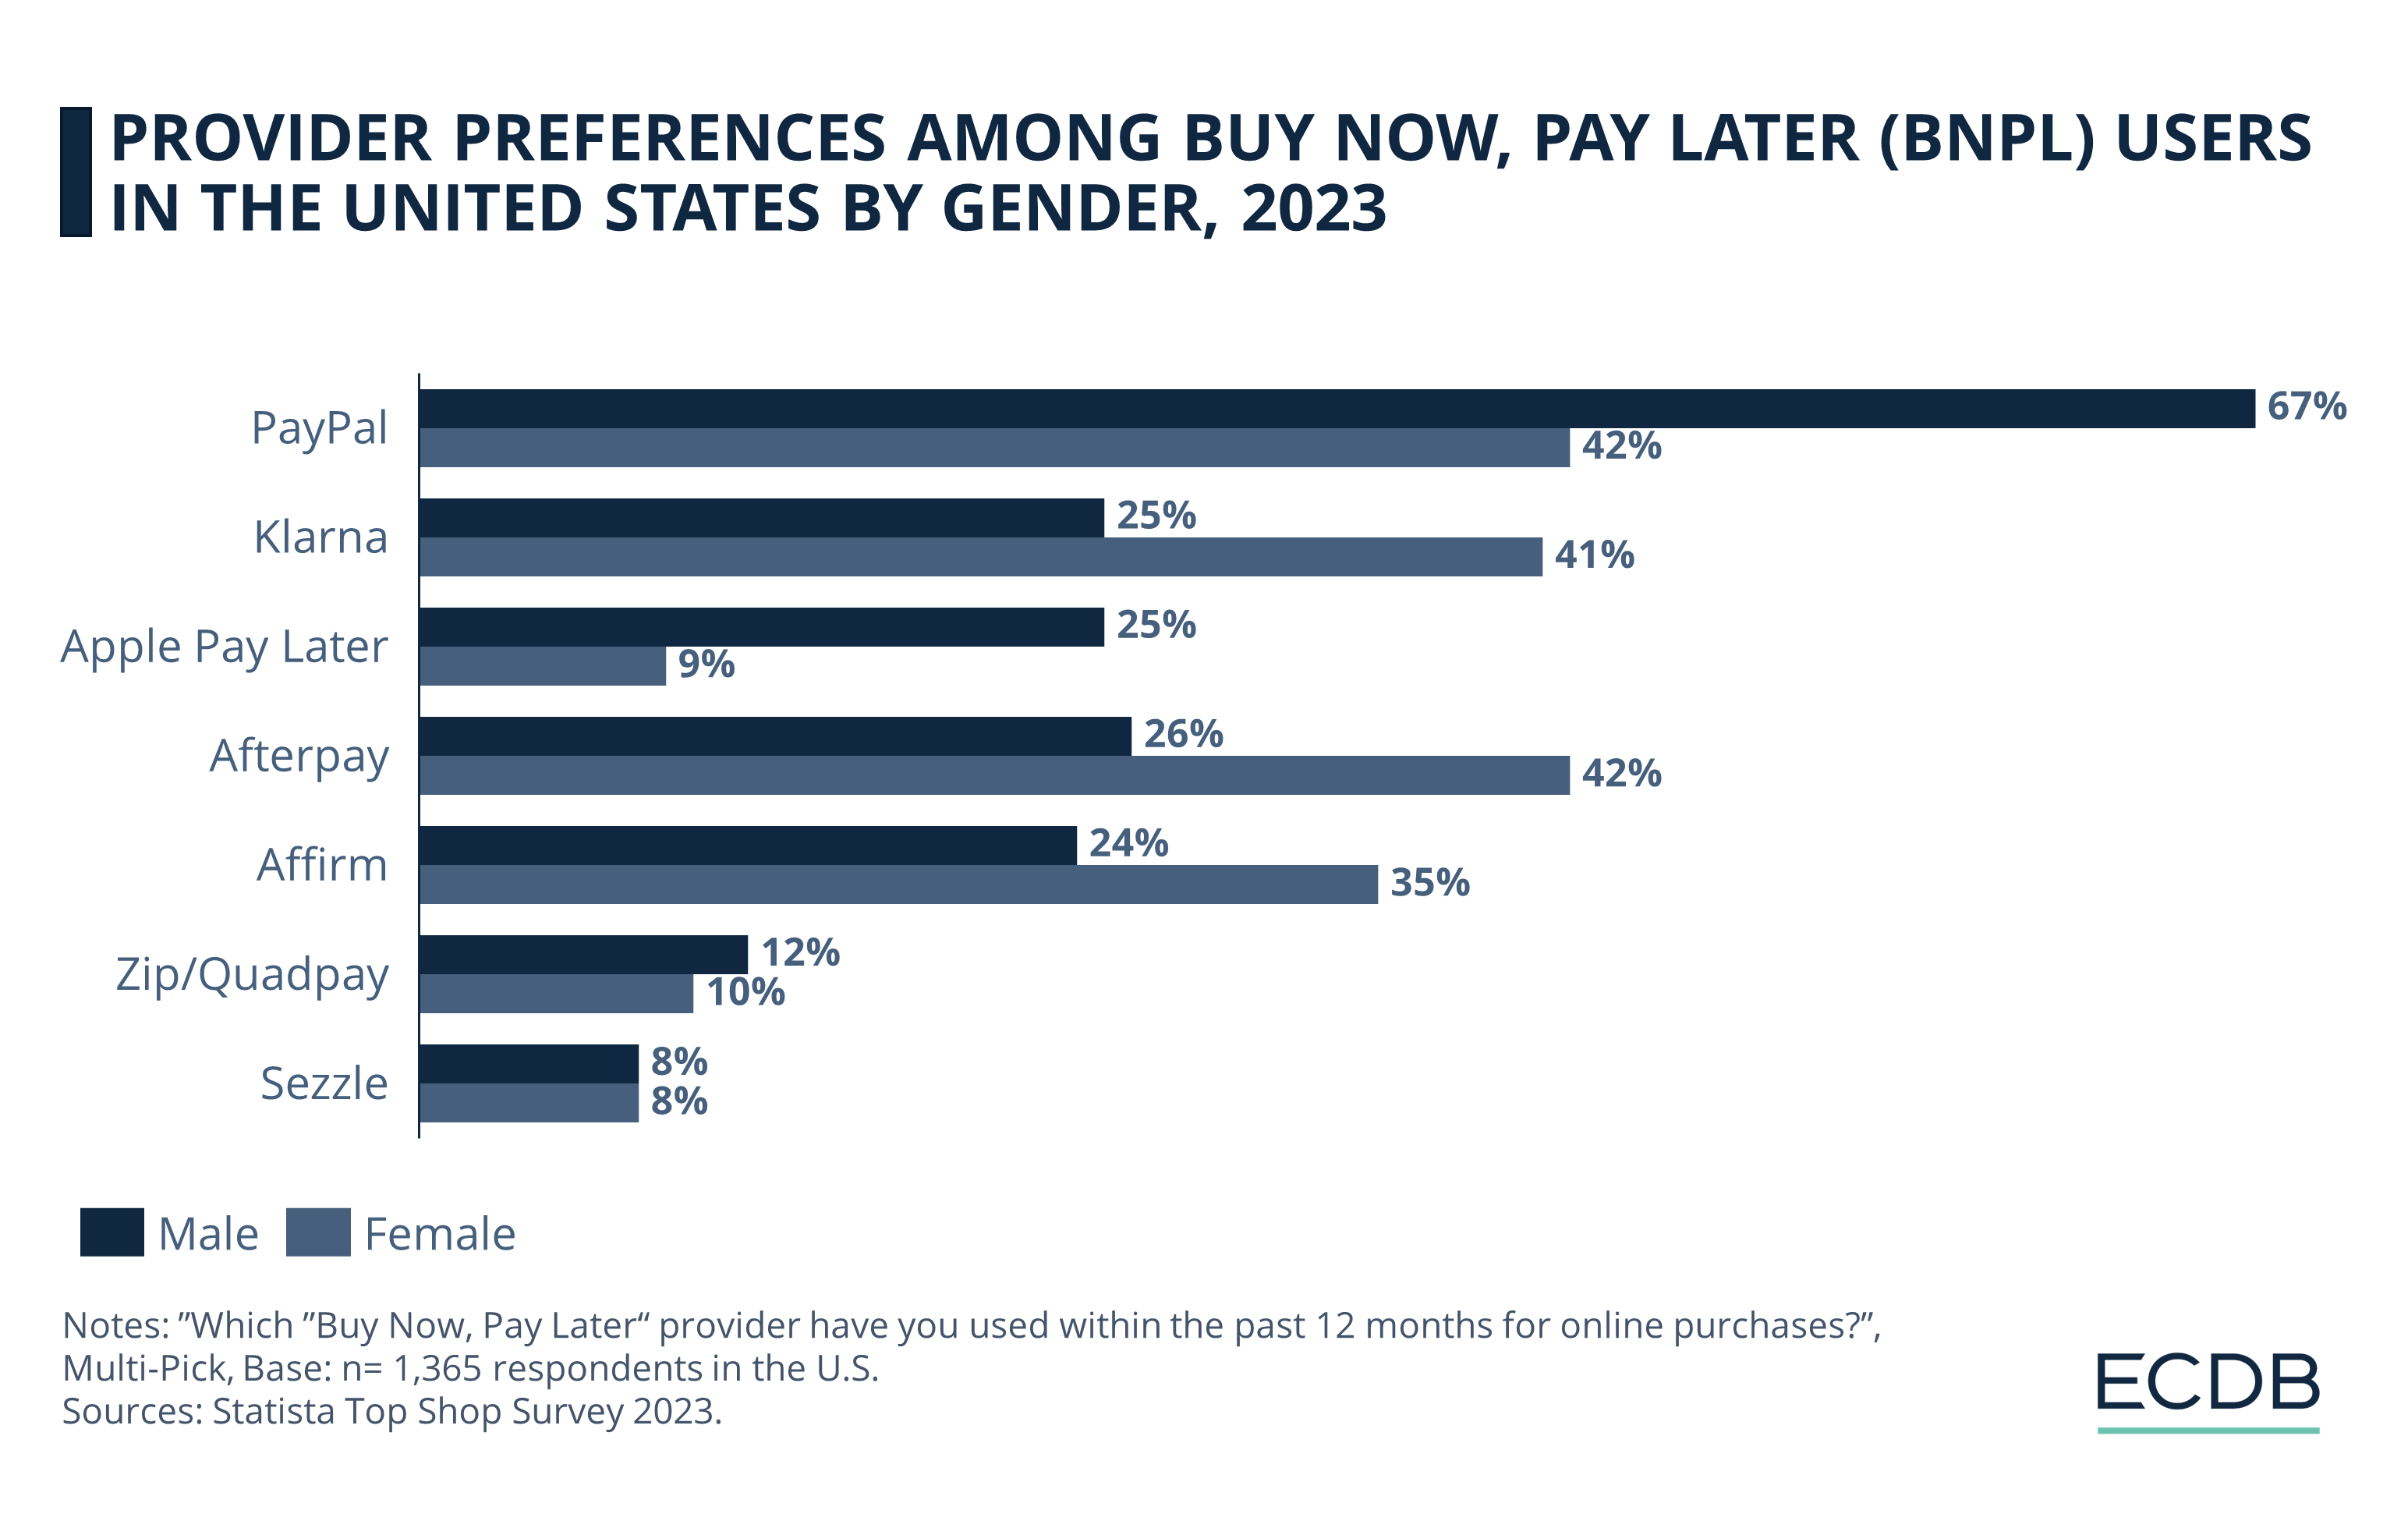
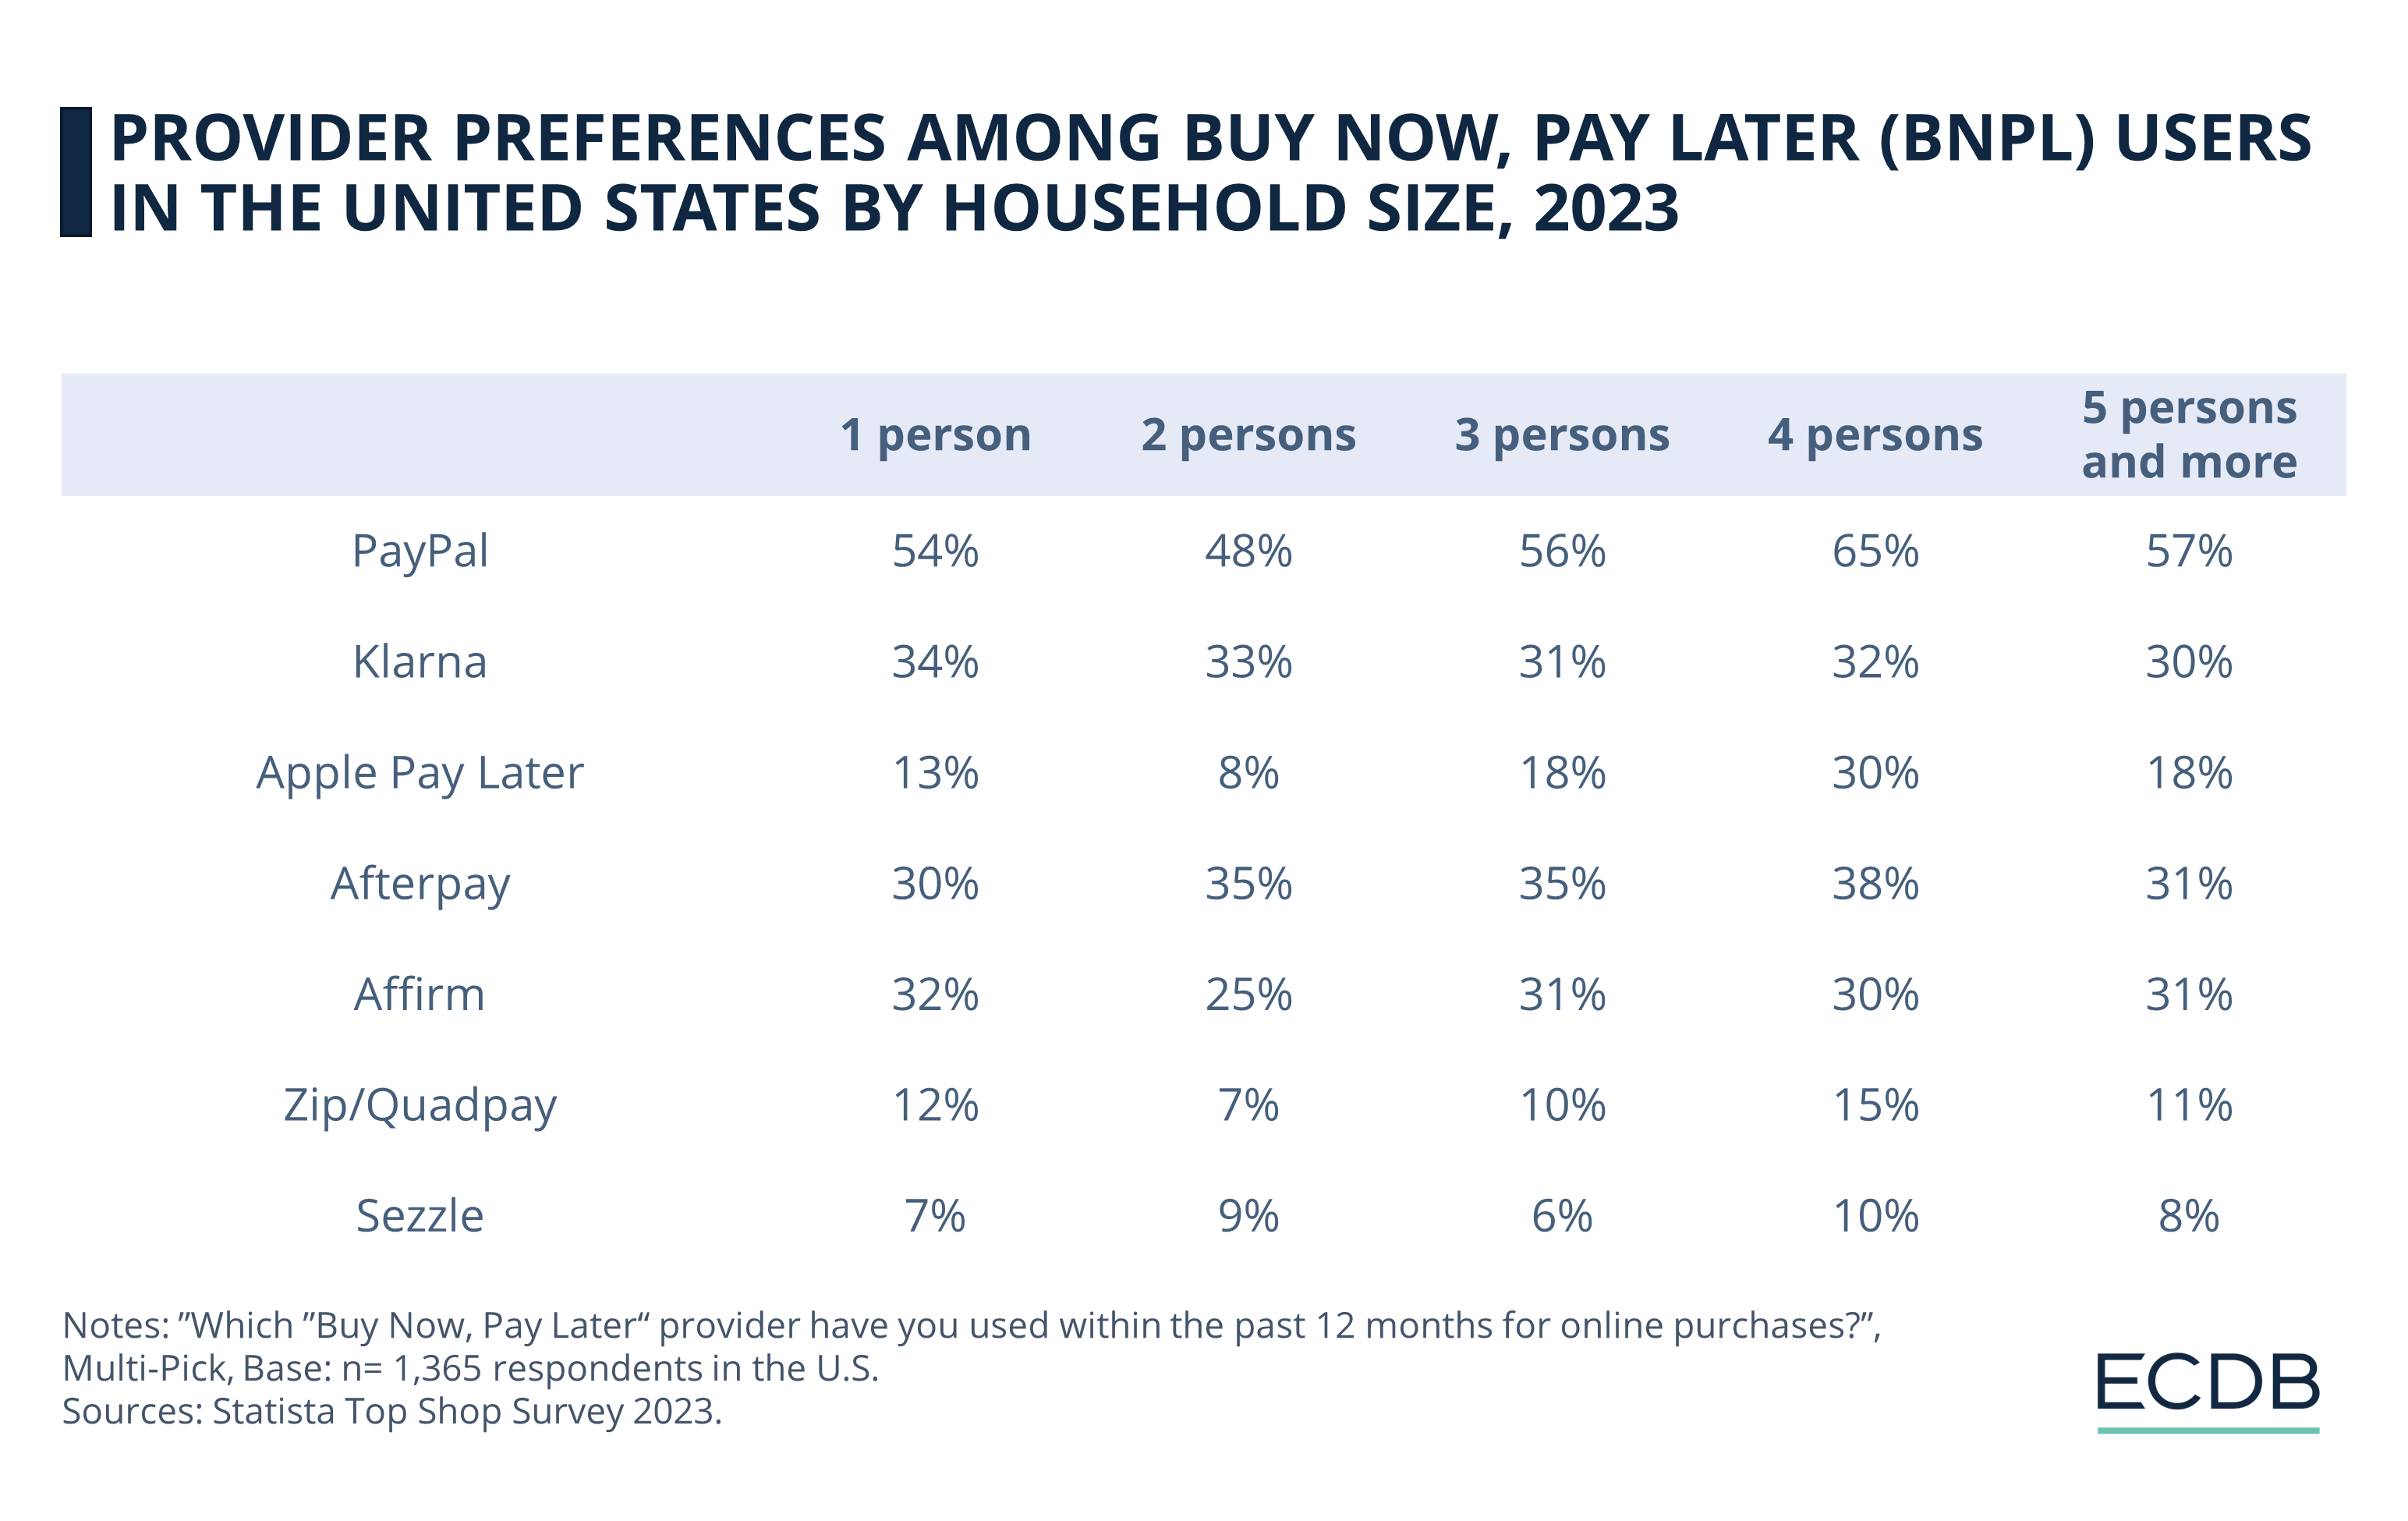
In respect to gender, PayPal shows a striking preference among male users, with 67% opting for it, compared to 42% of female users.
Among all providers we take into account, PayPal has the highest usage rate for each age group. While it is especially strong with the 25-44 age group, users aged 75 and above have also a high usage rate (63%).
A positive correlation exists between household income and PayPal usage. Additionally, PayPal is more likely to be used in bigger cities.
2. Afterpay
The Australian company Afterpay follows PayPal closely with a 34% usage rate in the U.S. The provider is particularly favored by households with four people (38%) and is more popular in larger cities.
As we covered before, younger generations favor BNPL for holiday shopping. This preference is less common among baby boomers. The trend of younger consumers opting for BNPL extends beyond seasonal shopping, indicating a shift in overall purchasing behaviors.
Gender-wise, Afterpay is more likely to be preferred by female users (42%) than males (26%). The provider is strongest among the 20-24 age group. As for income level, users with an annual household income of US$40,000 to US$50,000 (39%) form Afterpay's largest user base.
3. Klarna
Klarna, the Swedish fintech company, follows at number 3 with a significant 32% usage rate. Diverging from other providers we're looking at, 1 person households are the most likely (34%) to use Klarna.
Klarna differs from most providers in our scope, as it's most likely to be used in cities with 500,000 to 1 million inhabitants. Female users (41%) are more likely to use Klarna than males (25%) — a similar gender split to that of Afterpay.
While Klarna's strongest user base (41%) is users with US$40,000 to US$50,000 of annual household income, the provider is particularly strong with the age group 20-34.
4. Affirm
Coming in fourth, Affirm holds a substantial share with a 29% usage rate. Founded by PayPal co-founder Max Levchin, the provider is most likely to be used in 1 person households (32%).
In comparison to other income groups, users with US$40,000 to US$50,000 of annual household income (35%) are the most likely to use Affirm. The provider deviates from most providers in terms of city size, where it is more likely to be preferred in smaller cities.
BNPL's impact is evident in consumer spending. For instance, in Amazon Prime Days 2023, 6.5% of orders used BNPL, generating US$927 million in revenue, a 20% increase from the previous year. This trend is changing not just big sale days but also the holiday season, traditionally a stressful time due to gift expenses.
Affirm has a relatively balanced gender distribution among its users, with 24% of male users and 35% of female users. When it comes to age, the 55-64 age group is the strongest for Affirm at 37%.
5. Apple Pay Later
Although Apple recently announced that it would be discontinuing its BNPL service, the provider managed to capture 17% of the U.S. user base at the time of the survey. In terms of household income, there is a positive correlation between usage and users' household income, similar to PayPal.
Households with 4 people were the most likely to use the service (30%), while survey results show that Apple Pay Later was more likely to be used in larger cities. The provider had a pronounced gender gap, with a quarter of male BNPL users choosing Apple Pay Later, but only 9% of female users. In terms of age, Apple Pay Later was more popular among users up to the age of 44.
6. Zip
Formerly known as Quadpay, Zip is the 6th most popular BNPL provider in the U.S. with 11% users preferring it.
It is particularly favored by households with four people (15%) and is more commonly used in bigger cities. Similar to some other providers in our scope, Zip's strongest user base is users with US$40,000 to US$50,000 of annual household income (14%).
Zip shows a near-equal gender distribution, with 12% male and 10% female users. In addition, we see that younger users are more likely to prefer Zip.
7. Sezzle
Sezzle rounds out the list with 8% usage. It is most popular among households with four people (10%) and is more commonly used in bigger cities.
The Minnesota-based provider stands out as the most gender-neutral option, with both male and female users at 8%. Users with more than US$40,000 in annual household income are most likely to use Sezzle, while the provider mainly attracts users aged 25 to 54.
Stay Informed: Our rankings are continuously updated with the newest data from our models, offering valuable insights to enhance your business strategy. Curious about which stores and companies are at the forefront of eCommerce? Want to know which categories are leading in sales and popularity? Discover the answers in our rankings for companies, stores, and marketplaces. Keep ahead of the competition with ECDB.
Who Uses BNPL in the United States?
Looking at the user base, we see that almost a quarter (23%) of online shoppers in the U.S. have used BNPL in the past 24 months.
In relation to other age groups, users aged 25-44 are most likely to have used a BNPL service while older users can't imagine doing so.
When it comes to preferences among genders, male online shoppers are more likely to use a BNPL service in comparison to female shoppers. From a usage frequency perspective, male BNPL users tend to use the services more often, although the difference between genders here isn’t very pronounced.
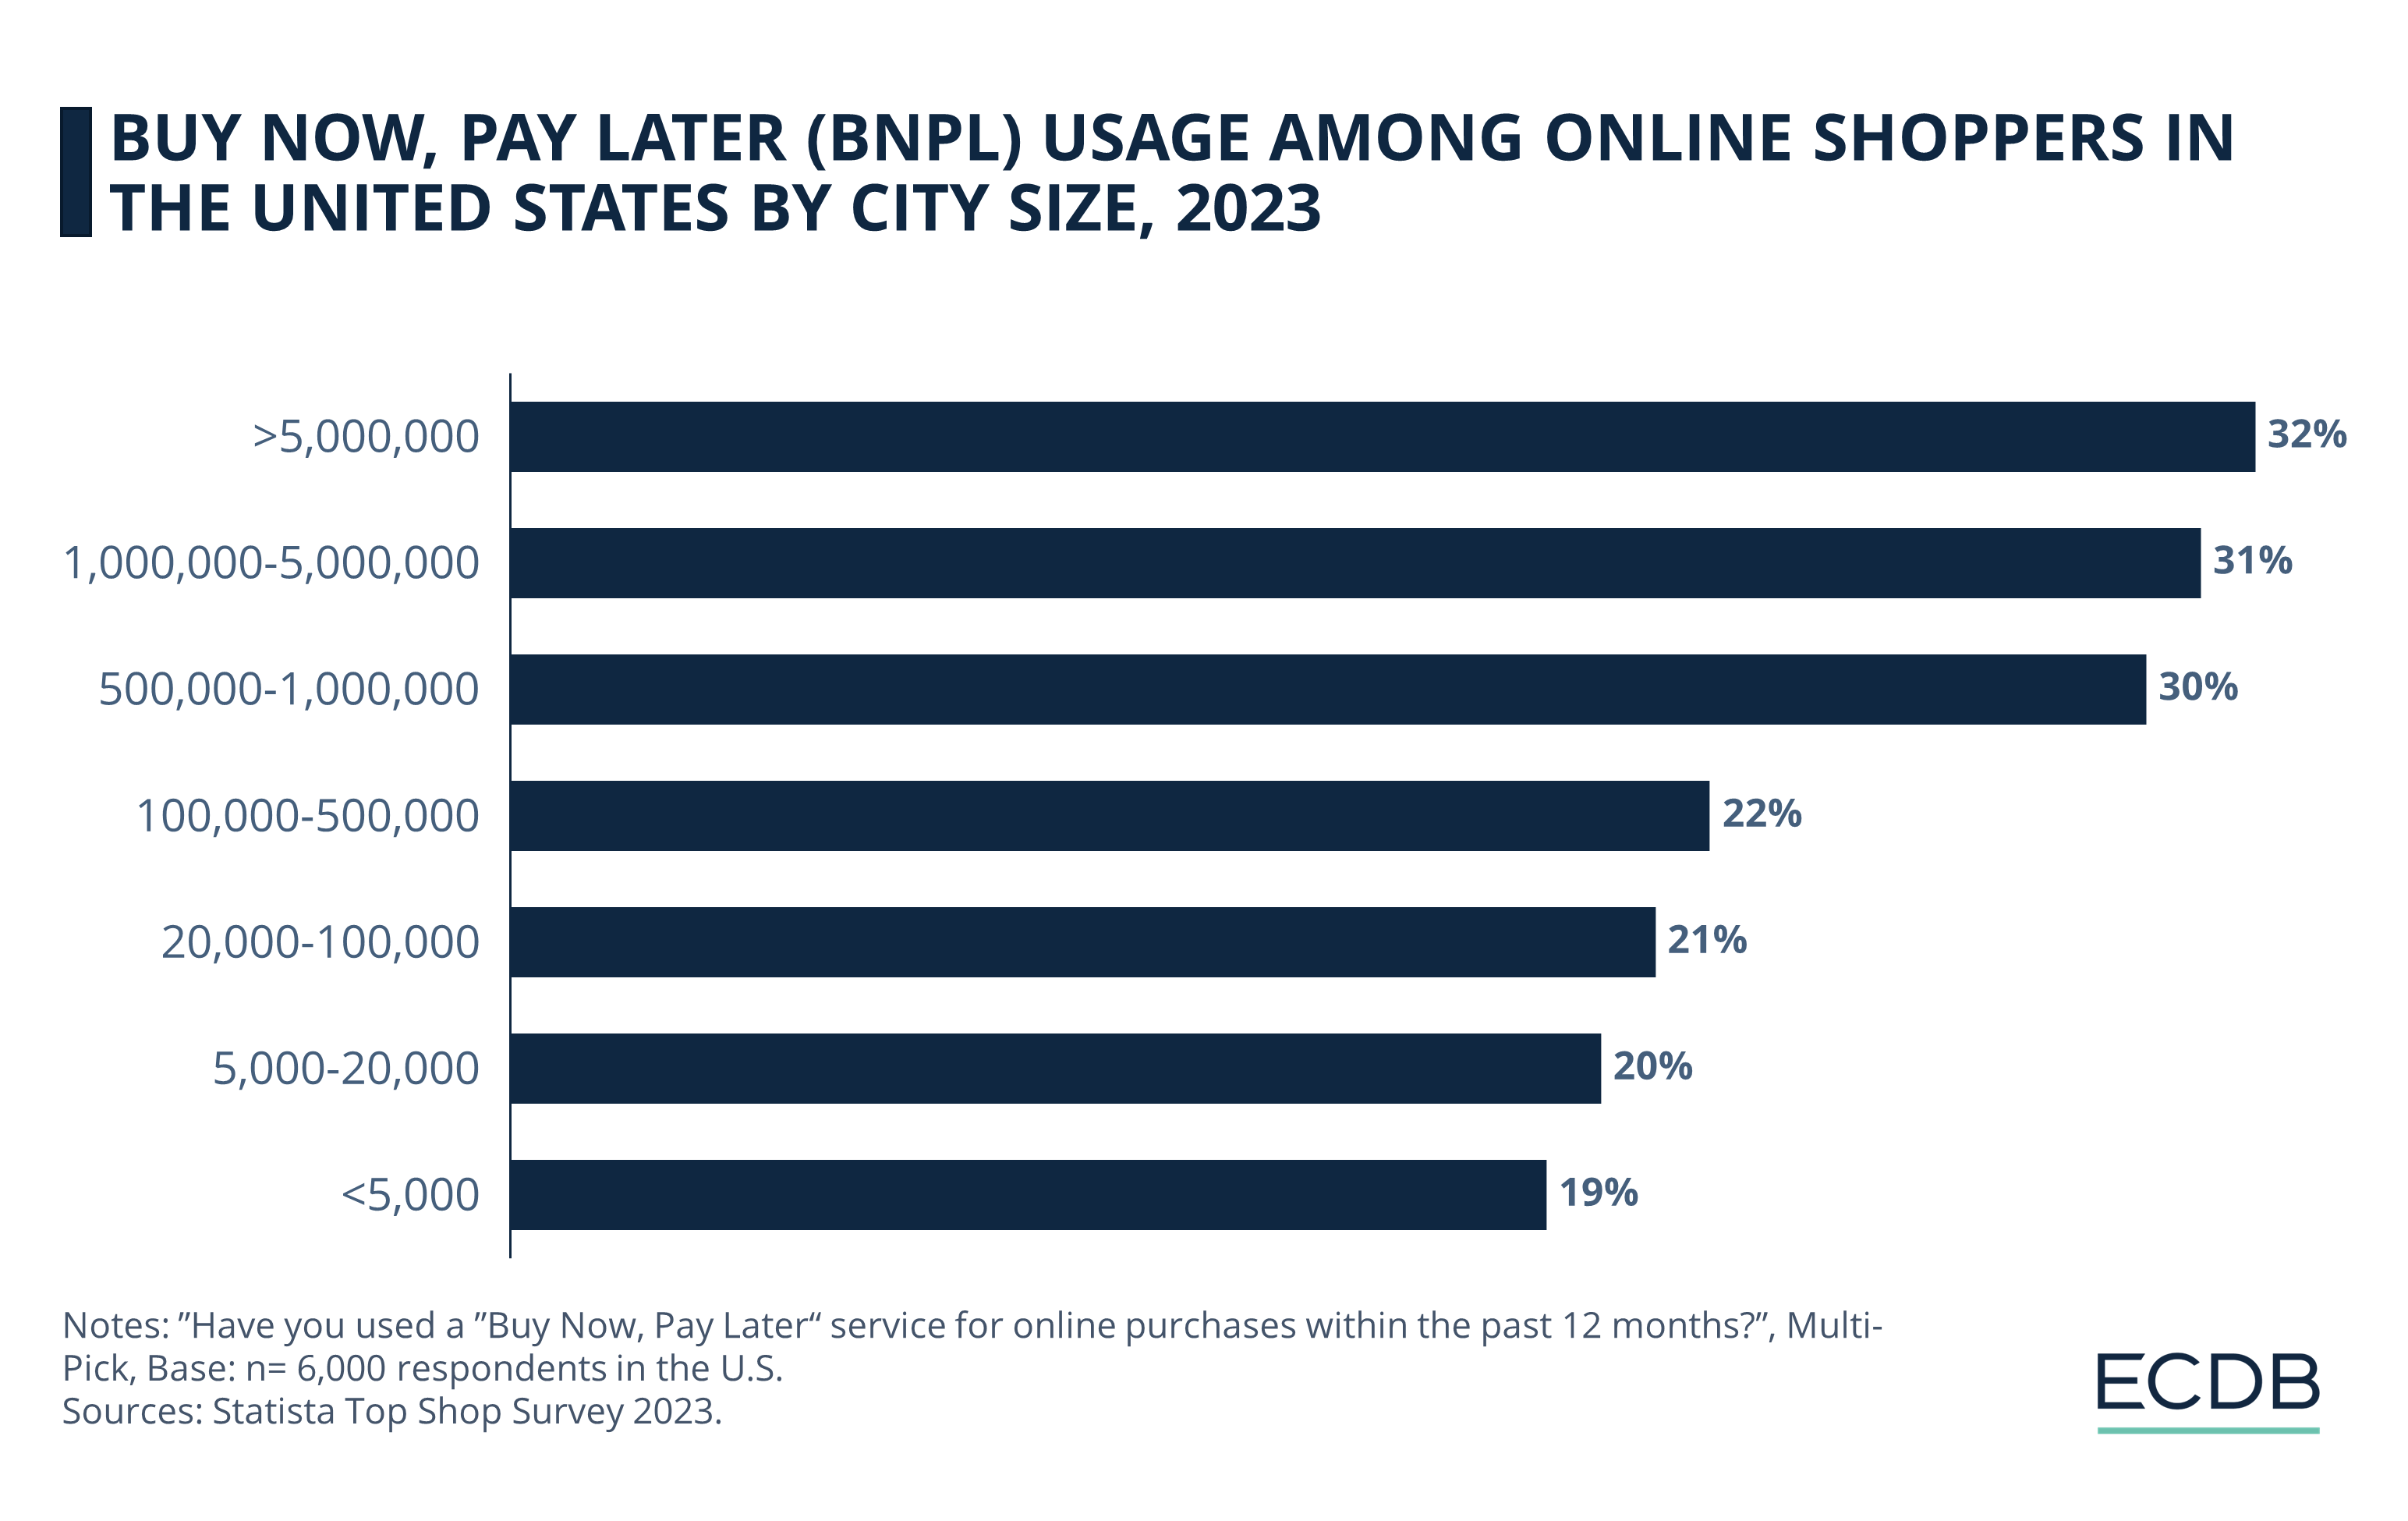
BNPL is More Common in Bigger Cities
The findings reveal no clear correlation between household income and BNPL shopping activity. Having said that, people from households with more than US$75,000 of disposable income yearly are slightly more likely to use the service.
Looking at another aspect of households, we see that online shoppers living in larger households (3+ people) are more likely to use BNPL services.
Concerning city size, another important metric in this context, the survey results confirm that the larger the city in which users live, the more likely they are to use a BNPL provider.
Top Reasons for Using BNPL in the U.S.
The obvious reason for using BNPL services is, well, to buy now and pay later. But let's go more granular and see what specific motivations U.S. consumers have to utilize the service.
Survey findings reveal that 60% of BNPL shoppers in the U.S. use the service because of more flexibility through installment purchases. In addition, 38% said that they could not have afforded the product otherwise.
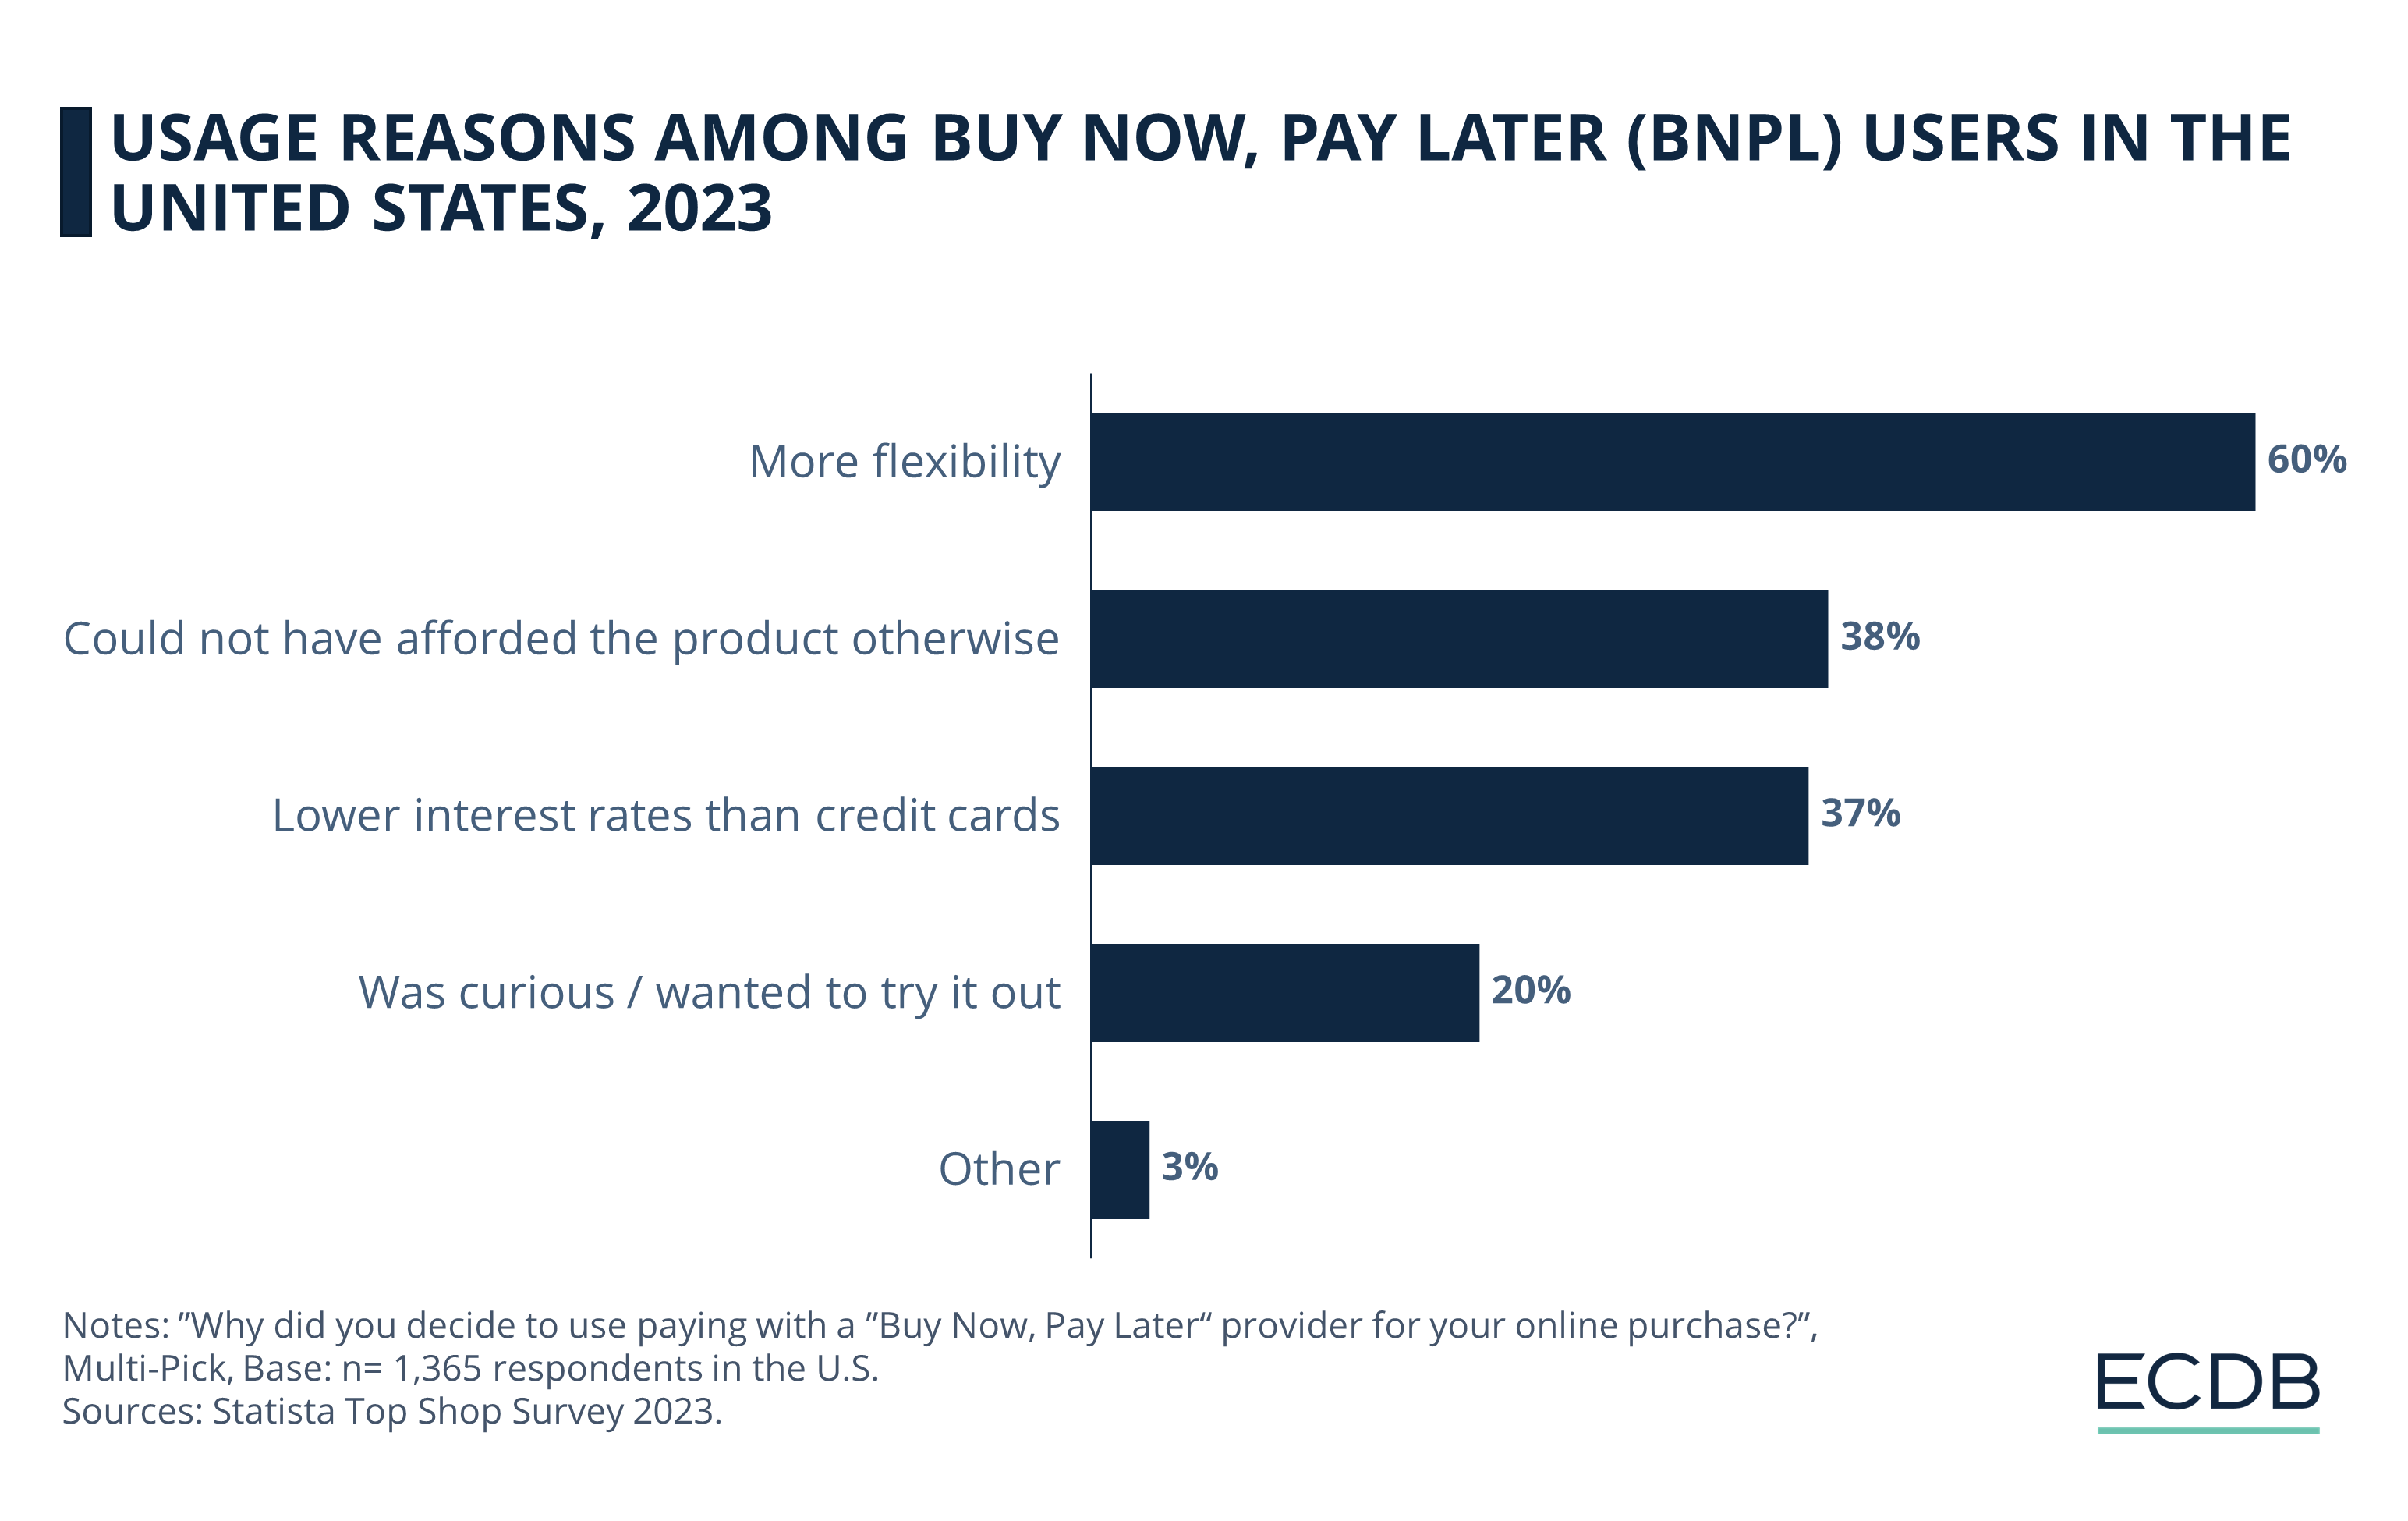
While lower interest rates compared to credit cards is another significant reason for users to opt for BNPL (37%), a fifth (20%) of users stated that they used BNPL services as they were curious and wanted to try it out.
More Women Than Men Use BNPL for Affordability
Despite disparities among users in terms of gender, the top reason for both female and male users to favor BNPL services is the flexibility they bring. While 62% of female users stated this reason, male users’ share is lower at 58%.
Almost half (48%) of female users said that they used BNPL as they couldn’t have afforded the product otherwise. The same reason was agreed upon by just below one third (29%) of male users.
Lower interest rates than credit cards is the second biggest reason (43%) for male users to make use of BNPL services, while 31% of female users expressed this reason. In addition to this, about a fifth of both male (19%) and female (21%) users said that they used BNPL services simply because they were curious.
Young and Senior Users Value Affordability and Curiosity in Using BNPL
Looking at BNPL usage reasons through the lens of age, we see that, “lower interest rates than credit cards” progressively becomes more significant through age groups, reaching its peak with the 35-44 age group at 29%, then decreasing in relevance towards older age groups.
The same pattern can also be seen in the case of “more flexibility”, with 40% of the 35-44 age group stating it as a BNPL usage reason.
In relation to other age groups, the reasons “could not have afforded the product otherwise” and “was curious / wanted to try it out” are the most important for the 18-20 and 65-74 age groups.
Higher Earners Value Low Interest Rates BNPL Offers
In relation to other income levels, users with more than US$50,000 annual household income have the highest response rate for the reason “lower interest rates than credit cards”. While we see a positive correlation between income level and “more flexibility” as a BNPL usage reason, “could not have afforded the product otherwise” is naturally more relevant for lower income groups.
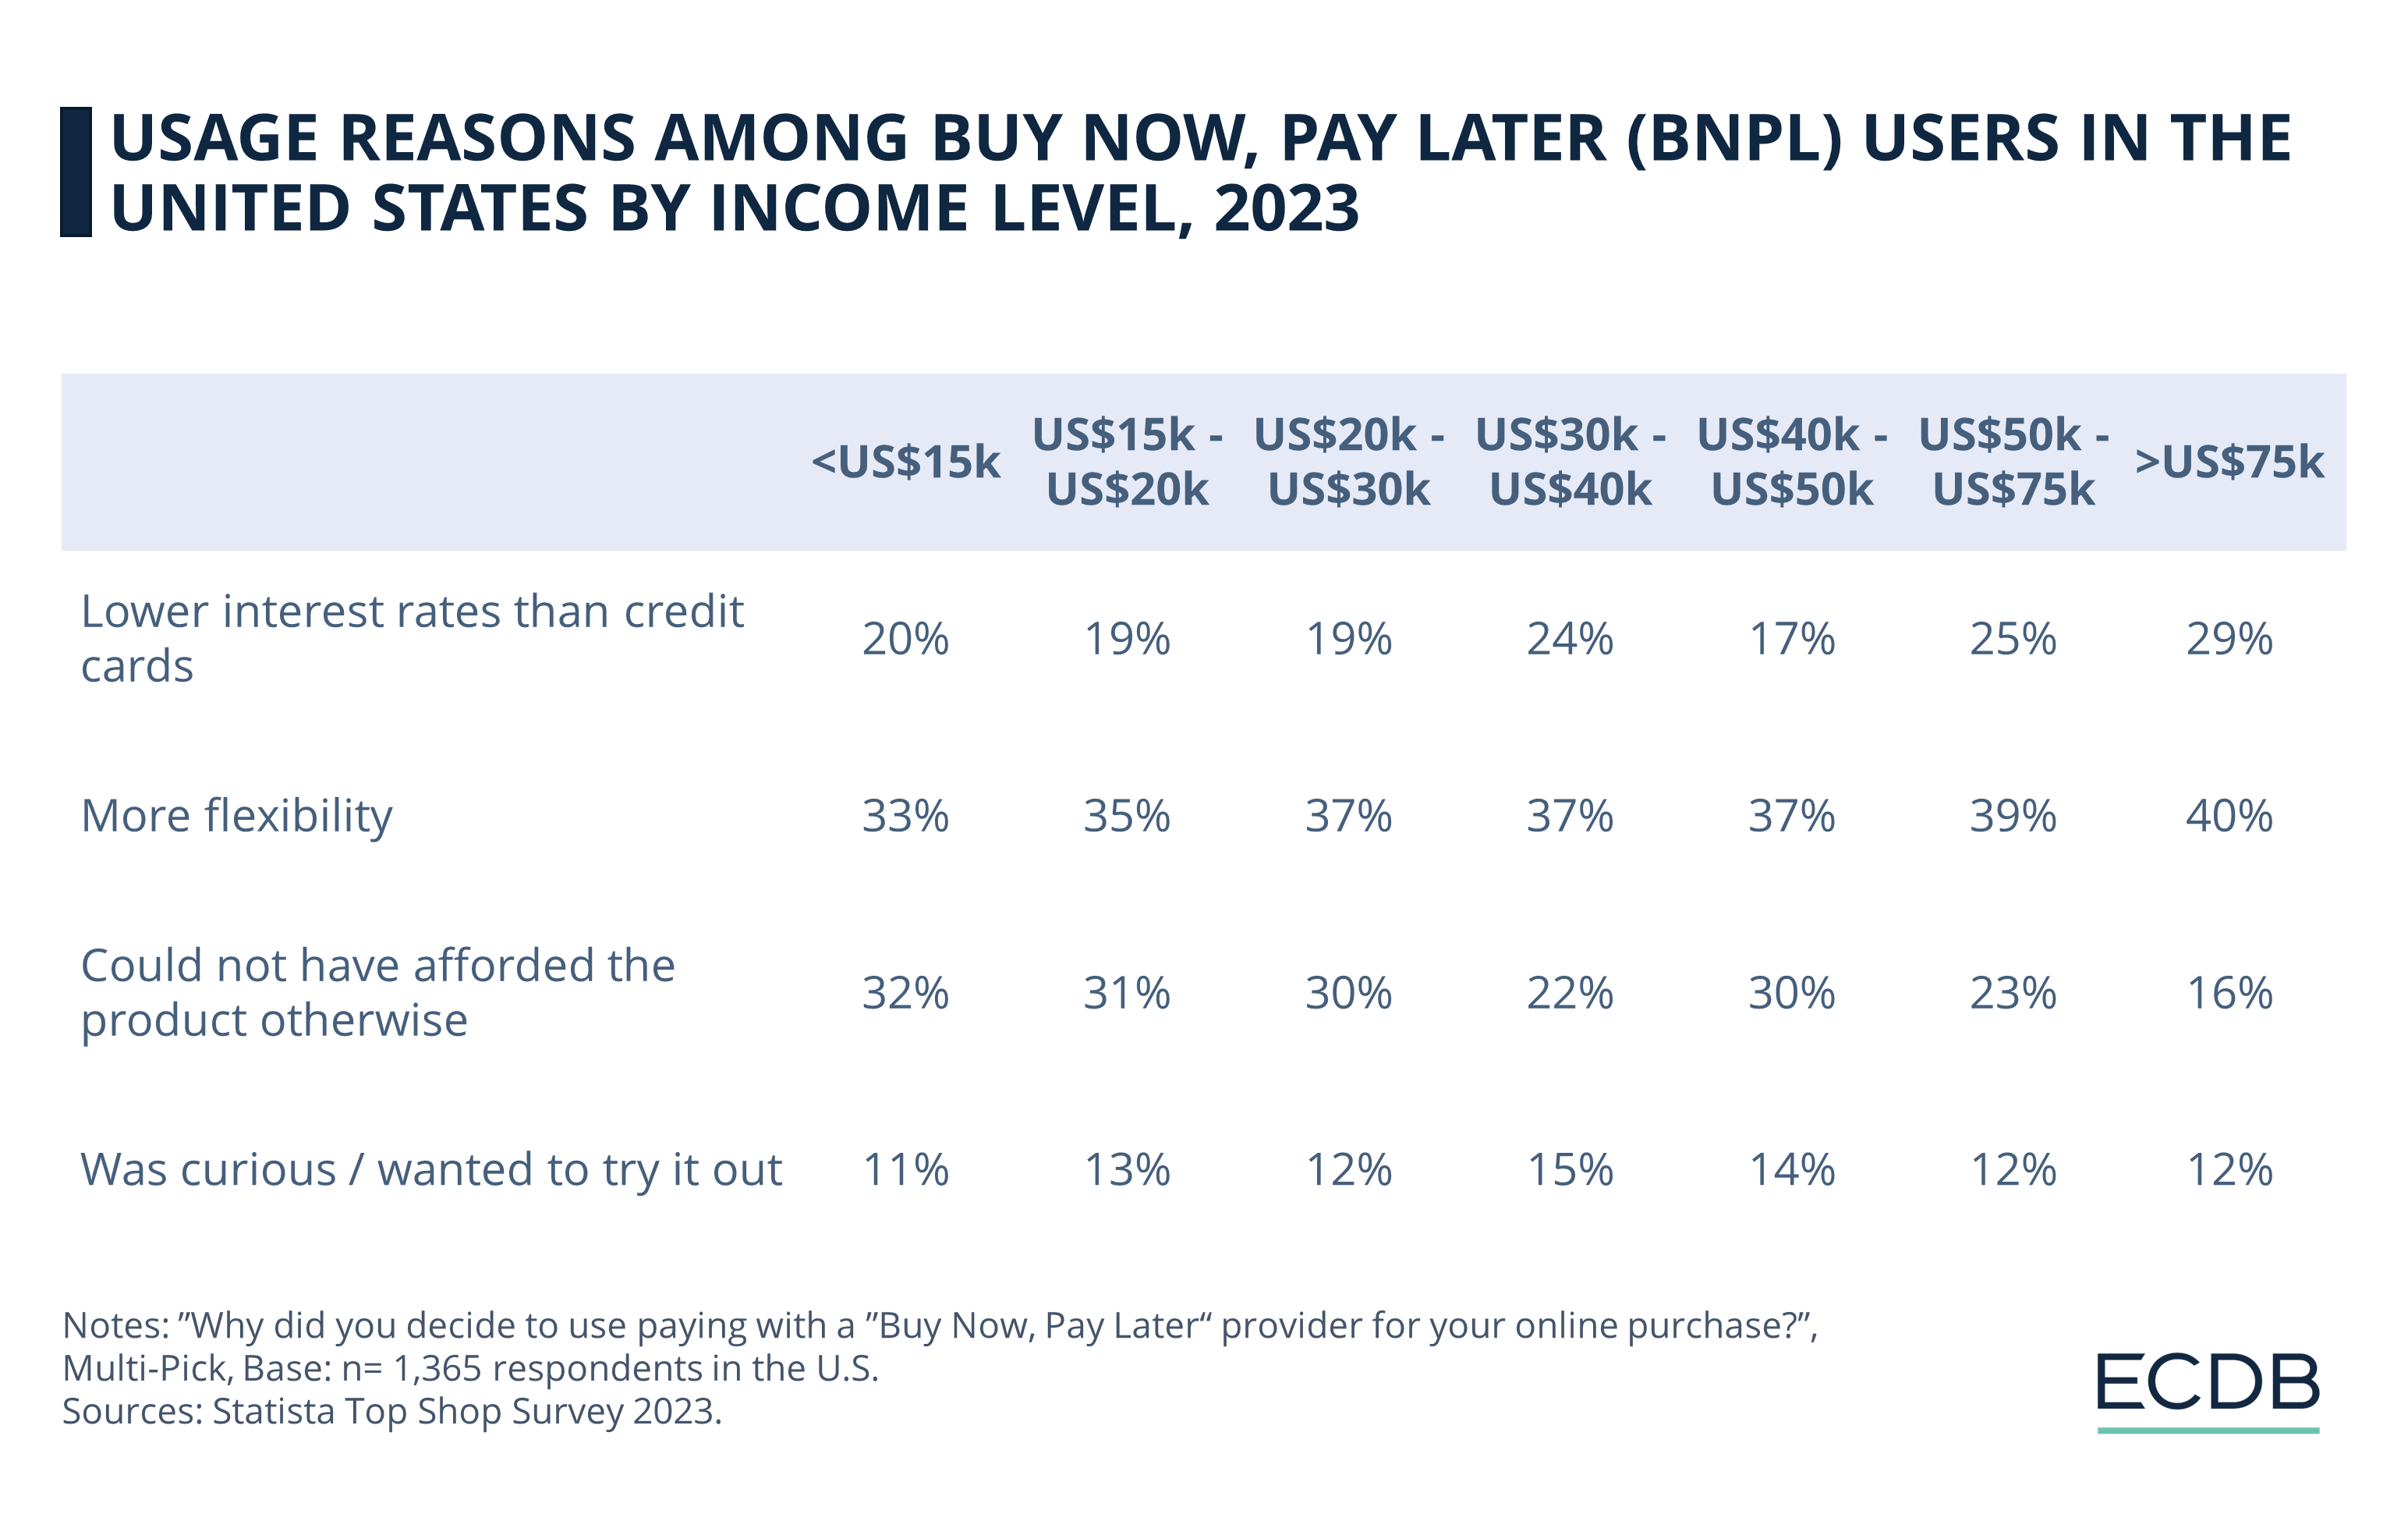
Despite having a low but consistent response rate among different income levels, the reason “was curious / wanted to try it out” resonates the most with users within the US$30,000-50,000 range, in relation to other income levels.
Larger Households Prioritize Flexibility and Savings in BNPL
For individuals living alone, the main draw is "more flexibility" in payments, cited by 36%. This reason holds steady or slightly increases as household size grows, peaking at 40% for four-person households. Interestingly, the appeal of "lower interest rates than credit cards" grows with household size, starting at 22% for one-person households and reaching 30% for four-person households, indicating that larger households might prioritize cost savings more.
The reason "could not have afforded the product otherwise" decreases in importance as household size increases, suggesting that larger households may have more financial flexibility. Curiosity about BNPL services shows a slight decrease from 13% in one-person households to 10% in households of five or more, possibly due to varying financial priorities or awareness levels among different household sizes.
Larger Cities Favor Flexibility and Lower Rates in Using BNPL
In smaller cities with less than 5,000 inhabitants, "more flexibility" in payments is a leading reason for choosing BNPL, noted by 34%. This preference for flexibility increases as city size grows, reaching up to 41% in cities with populations over 500,000. The interest in "lower interest rates than credit cards" also rises with city size, starting at 25% in the smallest cities and peaking at 30% in the largest urban areas (5+ million inhabitants), suggesting that the financial benefits of BNPL are more appealing in larger cities.
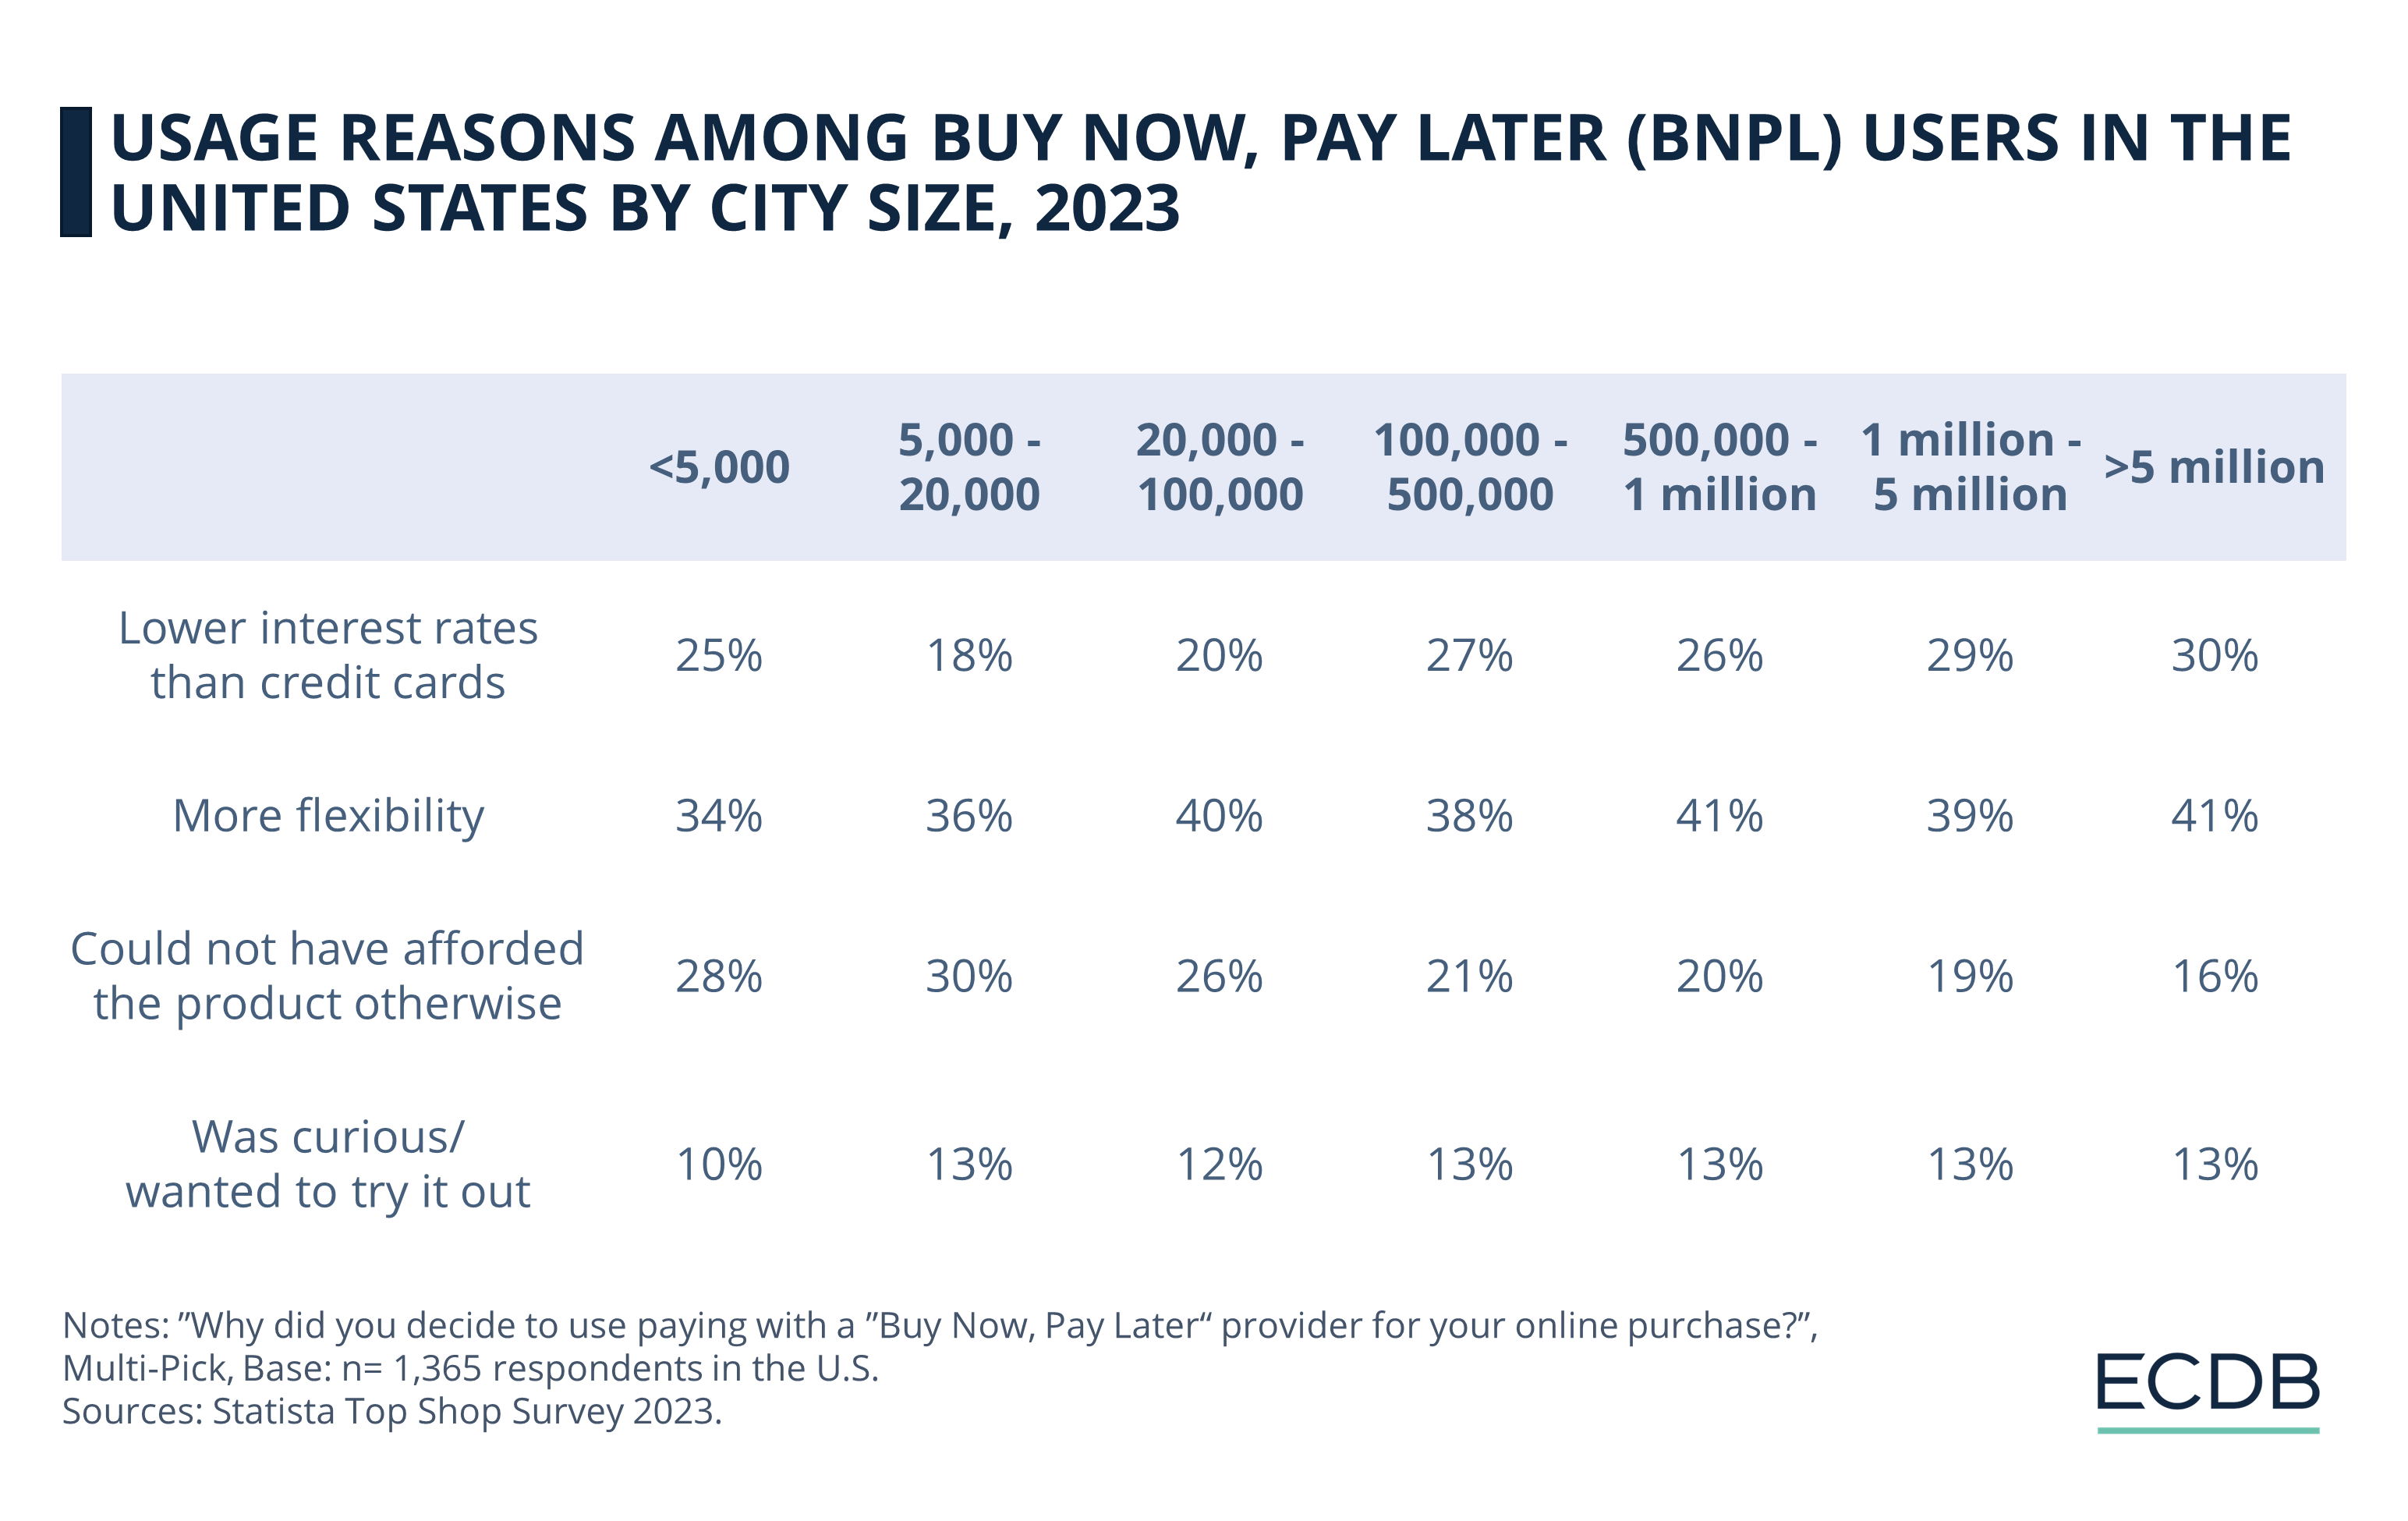
Conversely, the reason "could not have afforded the product otherwise" decreases significantly with city size, from 28% in the smallest cities to 16% in the largest, indicating that consumers in larger cities might have better financial stability or access to funds. Curiosity about BNPL services remains relatively constant across all city sizes, hovering around 10% to 13%, showing a uniform interest in exploring new payment methods regardless of urban setting.
Buy Now, Pay Later in the United States:
Final Thoughts
The rapid adoption of BNPL services in the United States highlights a change in consumer spending habits, driven by the demand for flexibility and lower interest rates compared to traditional credit cards. This trend is especially notable among younger generations, larger households, and urban inhabitants.
The growing popularity of BNPL also raises concerns about potential overextension of credit, particularly among younger and lower-income consumers who may struggle with managing installment payments.
As BNPL services continue to evolve, it is crucial for both consumers and providers to focus on responsible lending and borrowing practices. Consumers should be educated about the potential risks and encouraged to use these services wisely, avoiding unnecessary purchases that could lead to debt. Providers must ensure transparent terms, fair interest rates for extended plans, and robust credit checks to safeguard against defaults. While BNPL offers a convenient alternative to traditional credit, its long-term sustainability depends on a balanced approach that protects consumers from financial harm.
Sources: 9to5Mac, Statista, ECDB
Click here for
more relevant insights from
our partner Mastercard.
Related insights
Deep Dive
Klarna’s Impact Is Strongest in Sweden and Norway
Klarna’s Impact Is Strongest in Sweden and Norway
Deep Dive
eCommerce in Canada: Top Stores, Market Development & Trends
eCommerce in Canada: Top Stores, Market Development & Trends
Deep Dive
eCommerce Payments in China: Alipay, WeChat & Top Payment Methods
eCommerce Payments in China: Alipay, WeChat & Top Payment Methods
Deep Dive
Top Online Payment Methods: eWallets, Cards & Bank Transfer
Top Online Payment Methods: eWallets, Cards & Bank Transfer
Deep Dive
Tinaba Partners with Alipay+ to Launch European Super App
Tinaba Partners with Alipay+ to Launch European Super App
Back to main topics