CROSS-BORDER ECOMMERCE
Cross-Border eCommerce in the United States: Marketplace GMV and Top Markets
What is the state of U.S. cross-border eCommerce in 2023? We analyze its marketplace import and export GMV, the top foreign markets for U.S. consumers, and the leading destination markets for U.S. goods – with a bonus comparison to China.
Article by Nashra Fatima | October 02, 2024Download
Coming soon
Share

Cross-Border eCommerce in China: Key Insights
Marketplace Import GMV: Although cross-border imports have grown in the past years, the import GMV of the U.S. in 2023 was modest at US$221 million.
Marketplace Export GMV: The value of cross-border exports has increased consistently, with the largest jump recorded in 2020. Export GMV was US$17 billion in 2023.
Consumers’ Top Choice: 53% of all U.S. cross-border consumers made their most recent purchase in China in 2023, making it their favorite foreign market. UK and Japan were next, but the share of respondents shopping there is much smaller.
Leading Destinations: Canada and Mexico are the top consumer markets for U.S. cross-border exports, followed by South Korea and Peru. But consumers in many of these countries are increasingly favoring China.
eCommerce opened up the world to online shoppers. The U.S. is among the leading markets for consumers to shop from worldwide. With a high internet and eCommerce penetration, U.S. consumers also have international markets at their fingertips.
So, what is the current state of cross-border eCommerce in the United States?
In this article, we examine our ECDB data on U.S. cross-border marketplace import and export. We also look at the top foreign markets for U.S. shoppers and the main countries whose consumers shopped cross-border from the U.S., including a comparison to China.
U.S. Cross-Border Imports: Domestic eCommerce Dominates
Cross-border marketplace import GMV refers to the total value of merchandise imported by consumers from marketplaces outside of their country of origin.
Our ECDB data shows that in the United States, the cross-border import GMV has increased over the past five years:
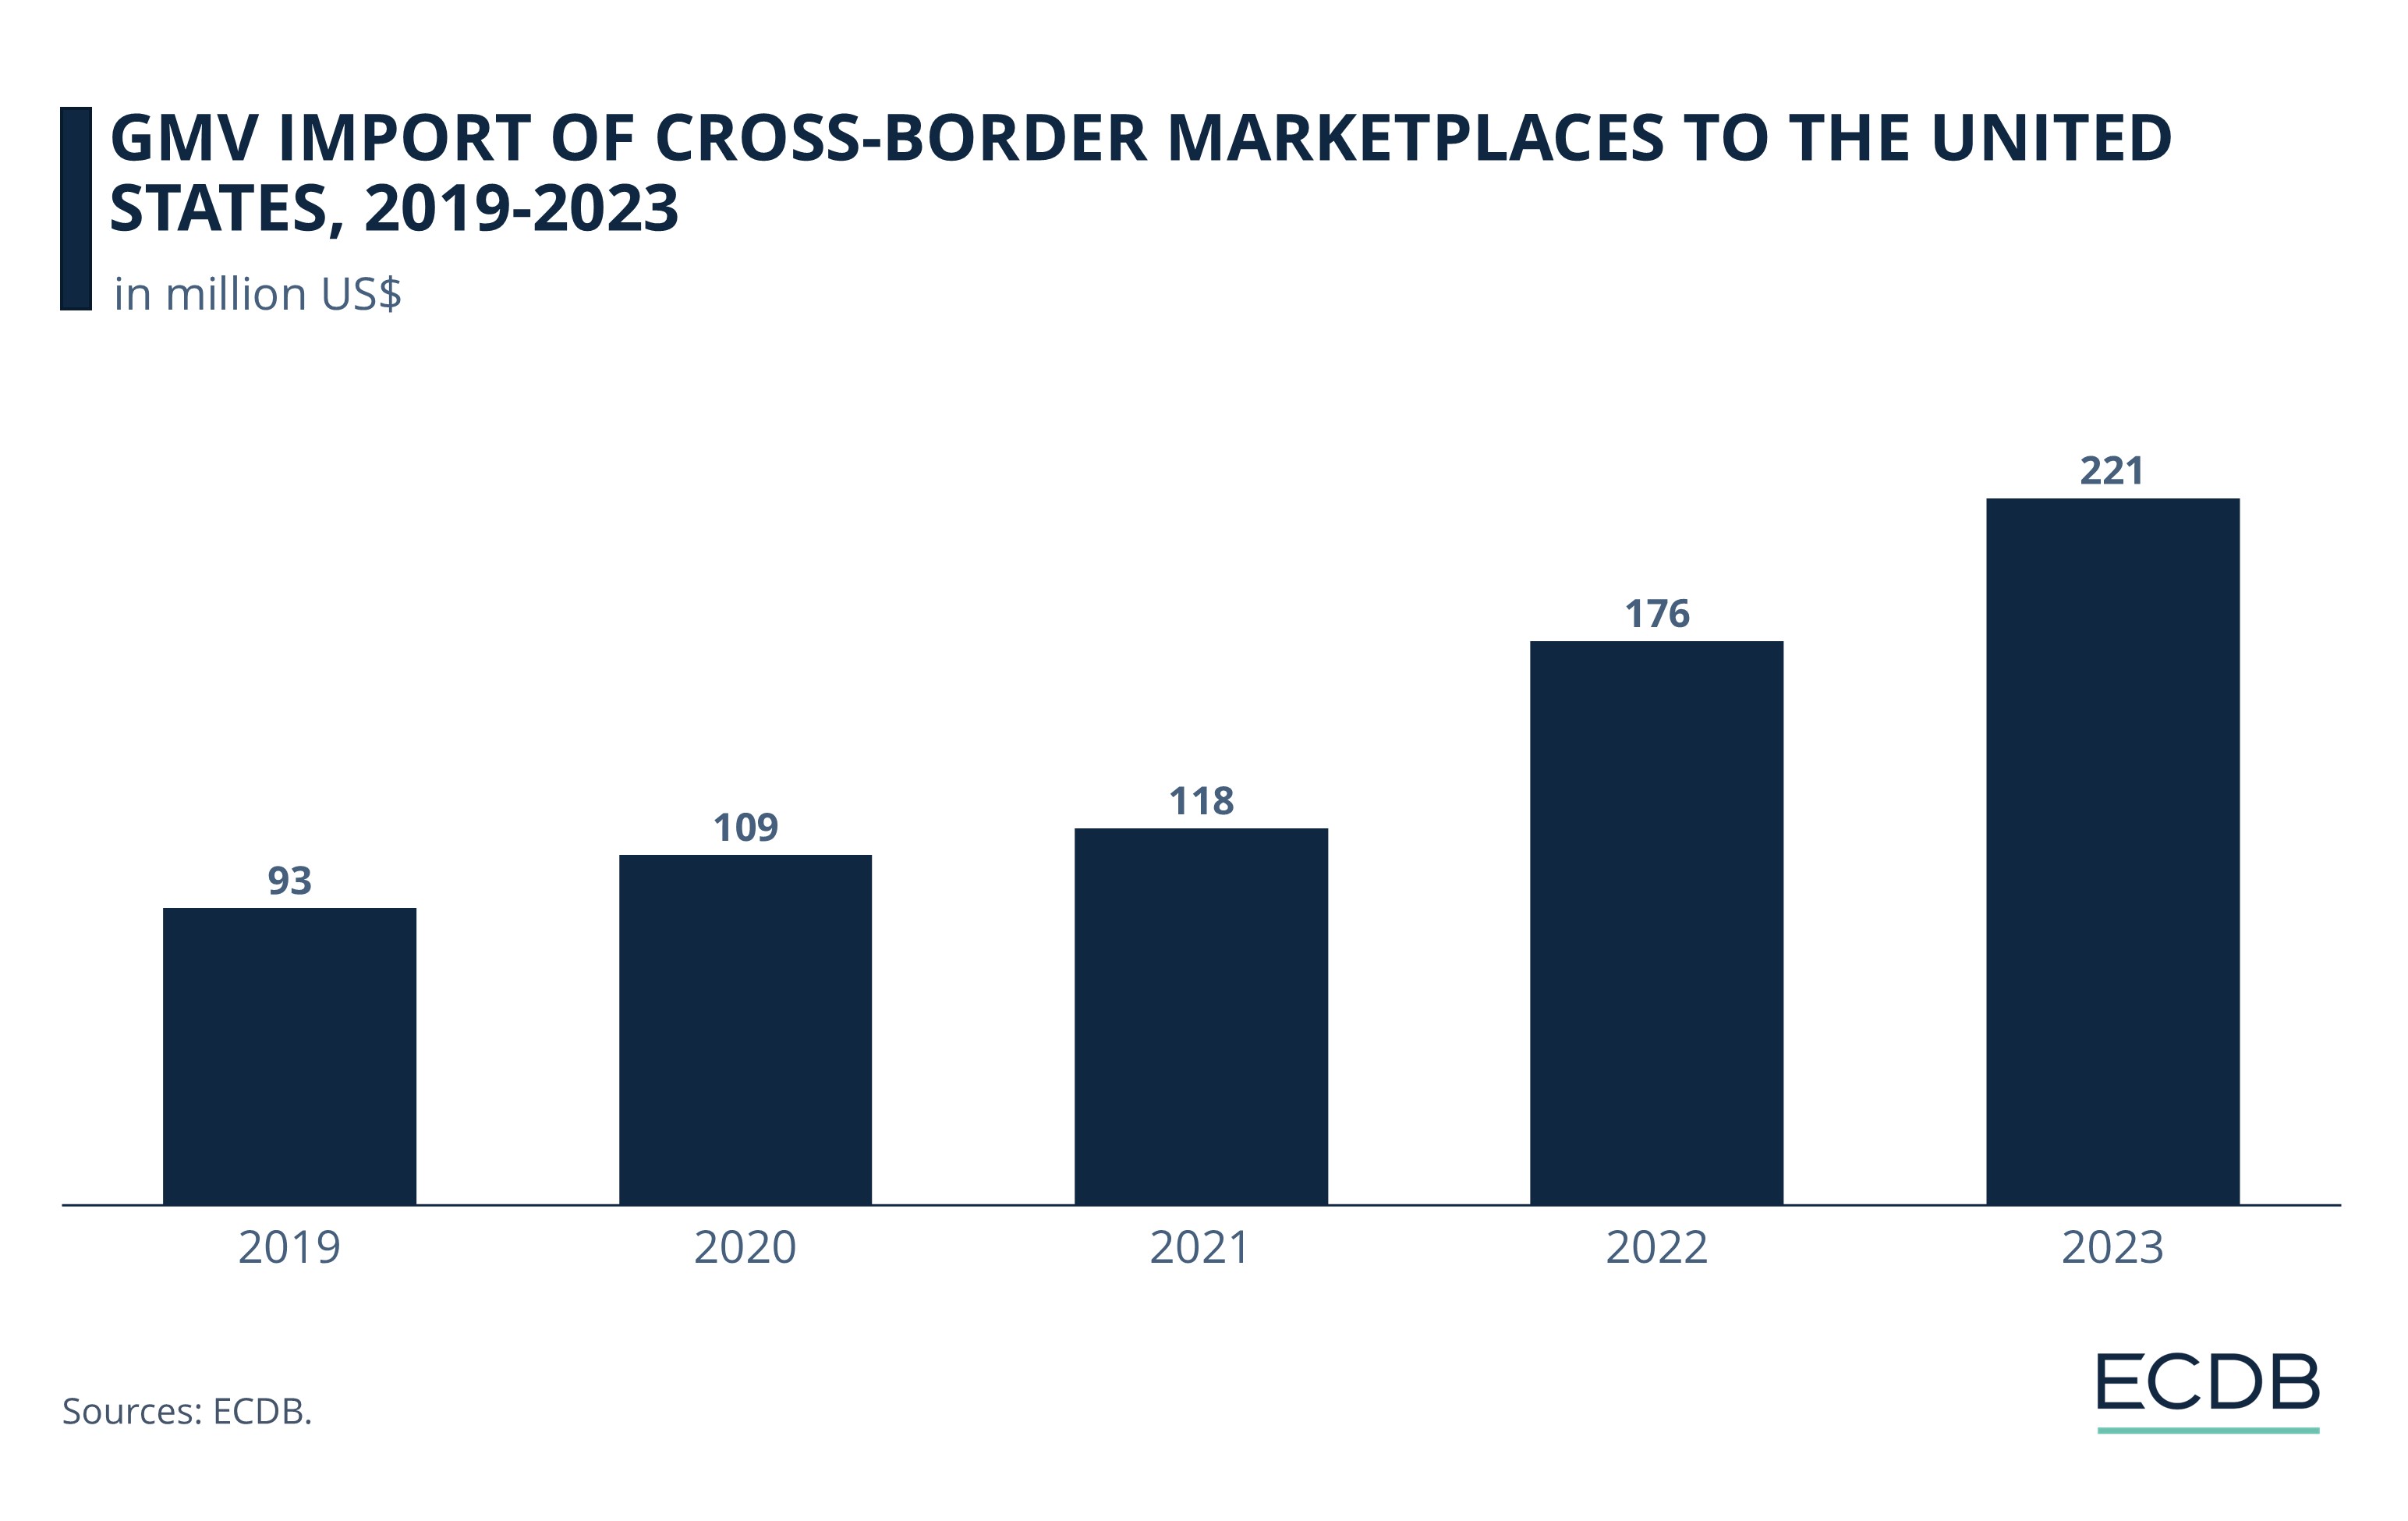
Between 2019 and 2021, the GMV of cross-border imports to the U.S. climbed from US$93 million to US$118 million – an increase of 27%.
Subsequently, the import volume saw the largest jump: the marketplace GMV grew by 50% in 2022, reaching US$176 million.
The rate of growth slowed once more in 2023. Last year, the eCommerce import GMV was US$221 million.
Despite the growing GMV of cross-border imports, online consumers in the U.S. prefer to shop from domestic or nationally focused platforms. An ECDB insight on global cross-border eCommerce shows that, unlike the UK, Japan, and Germany, the U.S. does not rank among the top ten target markets.
Data from Statista Digital Market Outlook of 2024 further corroborates that the cross-border share remains low in the U.S., only accounting for 3% of its total eCommerce revenues. It is much lower than countries like Belgium (32%) or Austria (19%).
In comparison, where do U.S. cross-border exports stand?
U.S. Cross-Border Exports: Marketplace GMV Hit US$17 Billion in 2023
Cross-border export GMV refers to the total value of merchandise sold by marketplaces outside their country of origin.
While the U.S. has several well-known marketplaces including Walmart and eBay. Amazon is the biggest player in the game globally—and not just in terms of its brand name. Its total GMV was a massive US$728.8 billion in 2023.
The latest ECDB data shows that overall, the United States’ cross-border marketplace exports have grown consistently in value since 2019.
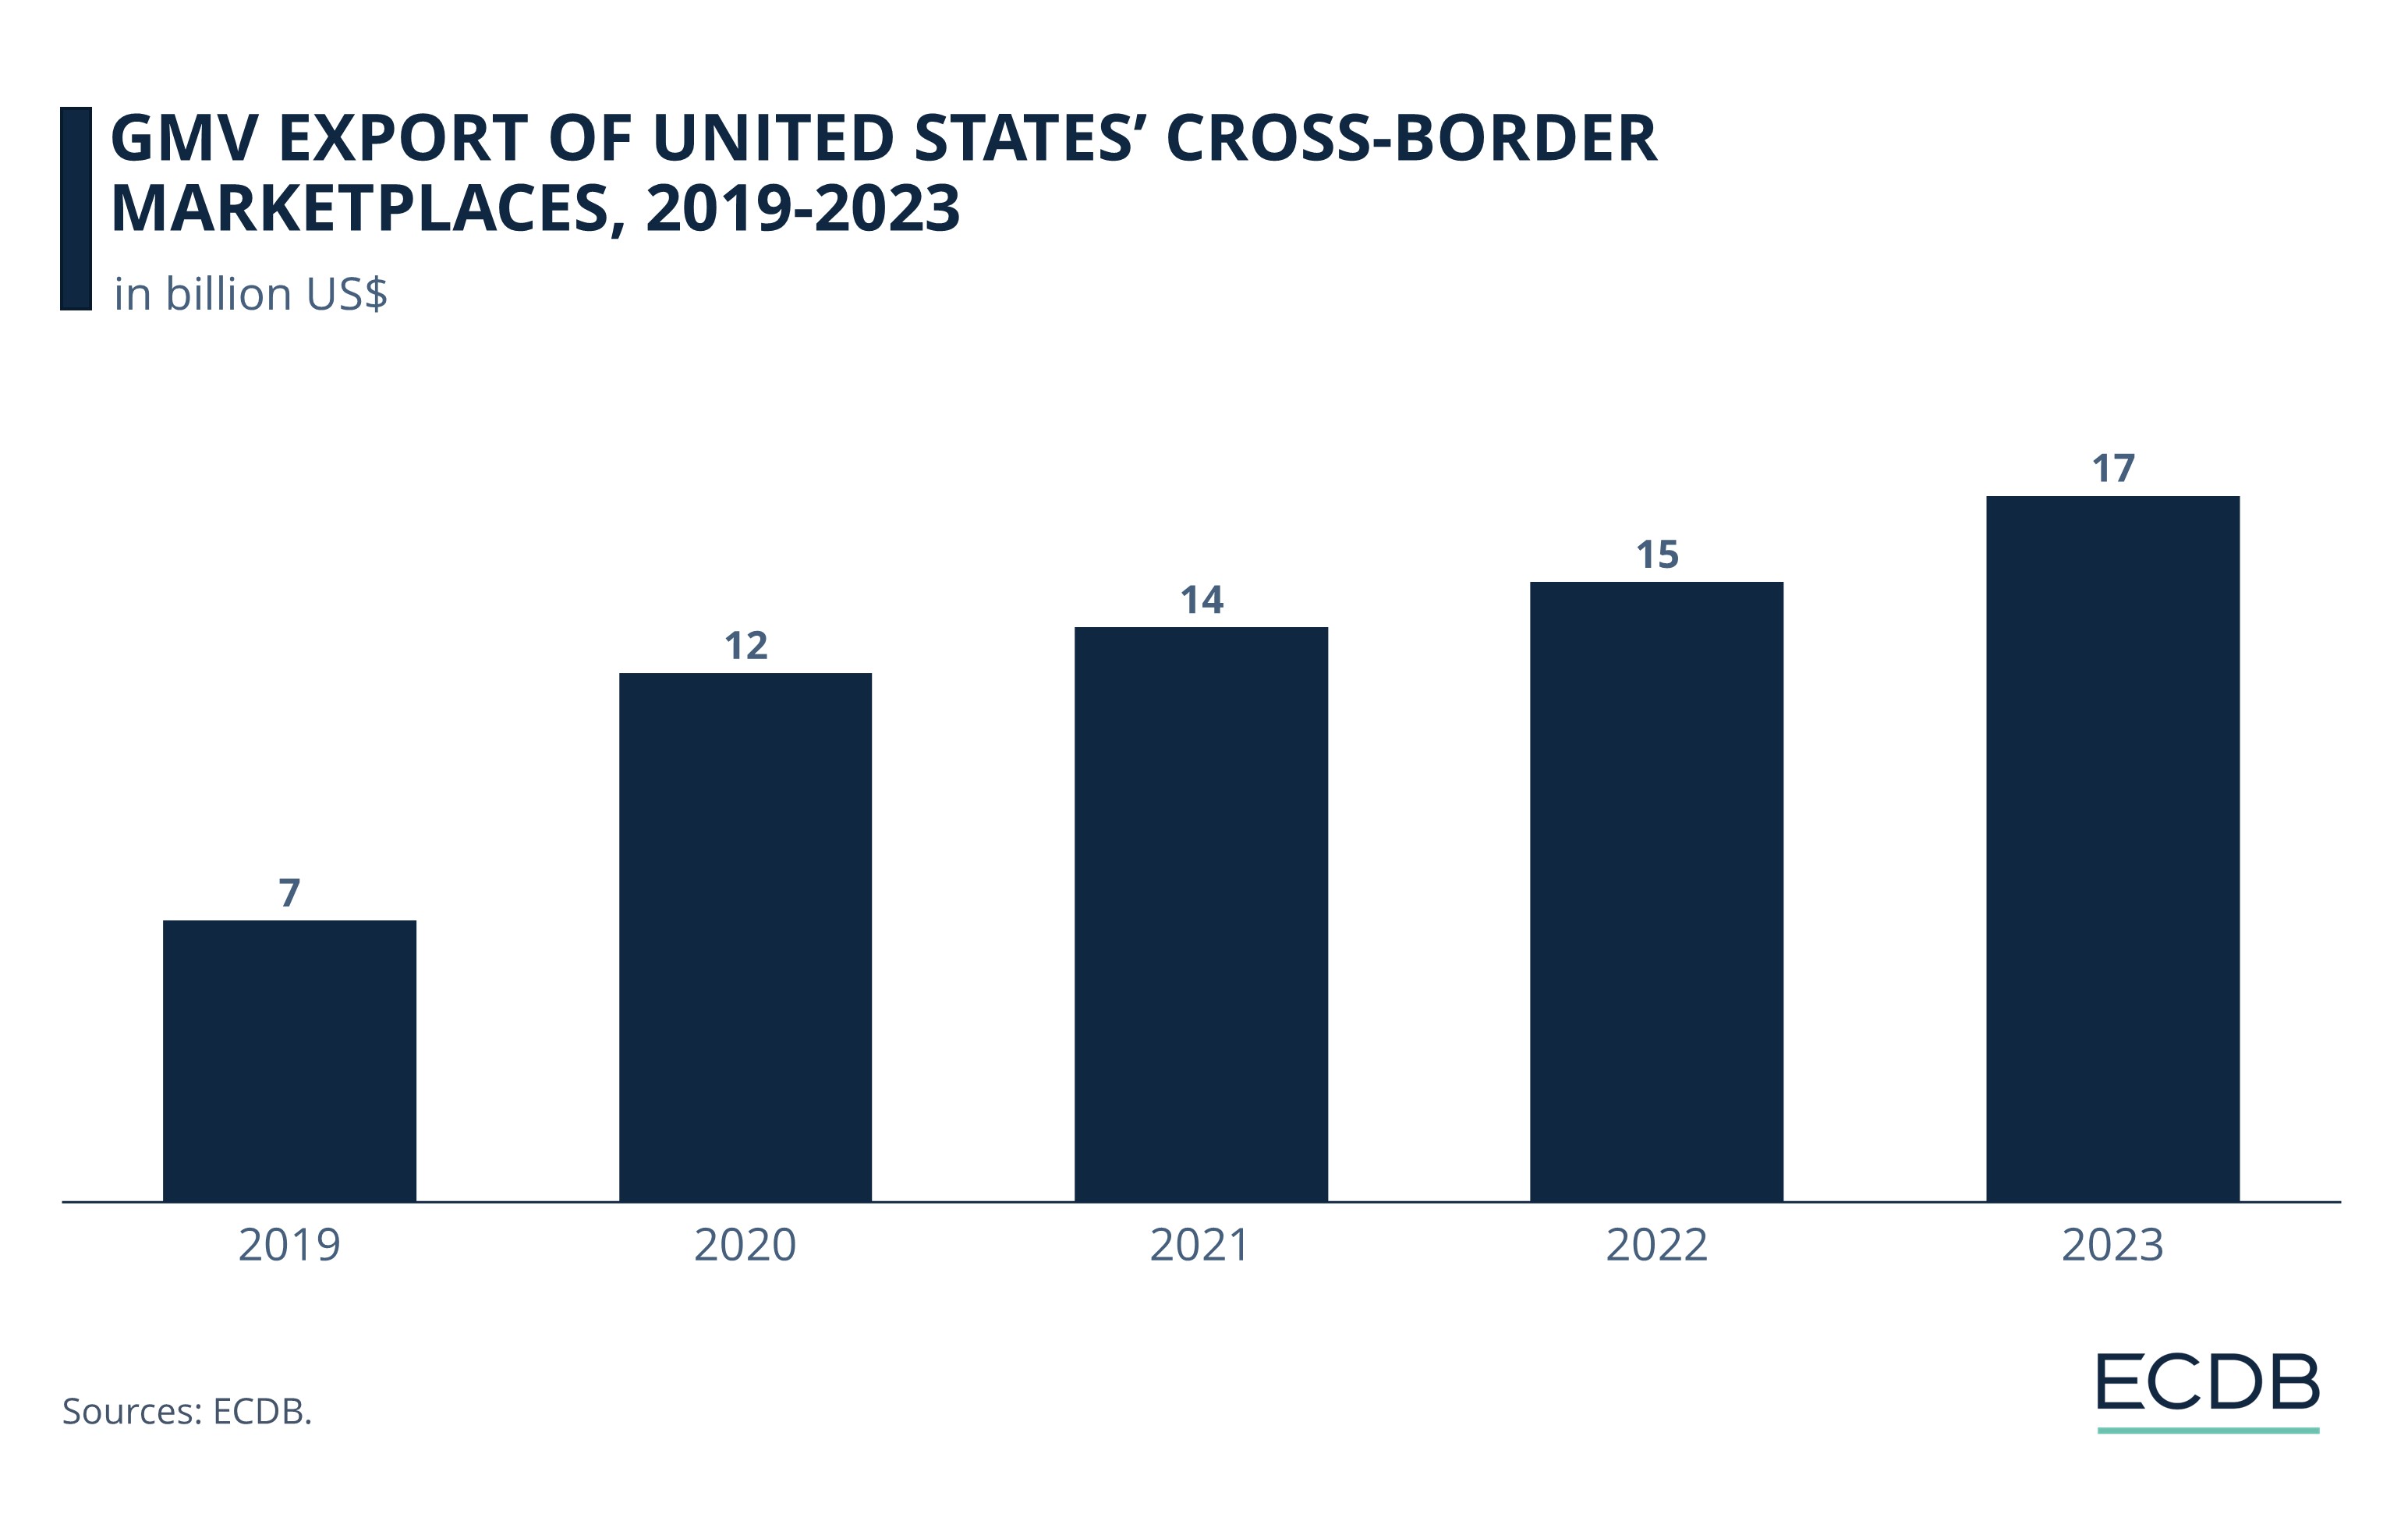
The cross-border exports market grew tremendously between 2019 and 2020. The marketplace GMV for exports had reached US$12 billion in 2020 from US$7 billion seen in the past year – an increase of 88%.
Growth was more modest in the next two years, with the GMV reaching US$14 billion in 2021 and US$15 billion in 2022.
The pace picked up again in 2023, with exports GMV climbing by 14% to hit US$17 billion.
Cross-border exports from the U.S. far outweigh imports in terms of marketplace GMV. This consolidates the United States’ position as a leading eCommerce market for foreign consumers. However, its popularity is now dwarfed by China, which is the top cross-border market globally.
Data on the top markets where U.S. cross-border consumers shop, and the leading destination countries for U.S. cross-border exports, paints a clearer picture.
Cross-Border Markets for U.S. Consumers: China Is a Big Favorite
With the global rise of eCommerce, it has become almost inevitable for consumers to explore markets beyond their national borders. So is the case with the U.S.
The Cross-Border eCommerce Survey of 2023 shows that when they shop abroad, U.S. shoppers overwhelmingly turn to China:
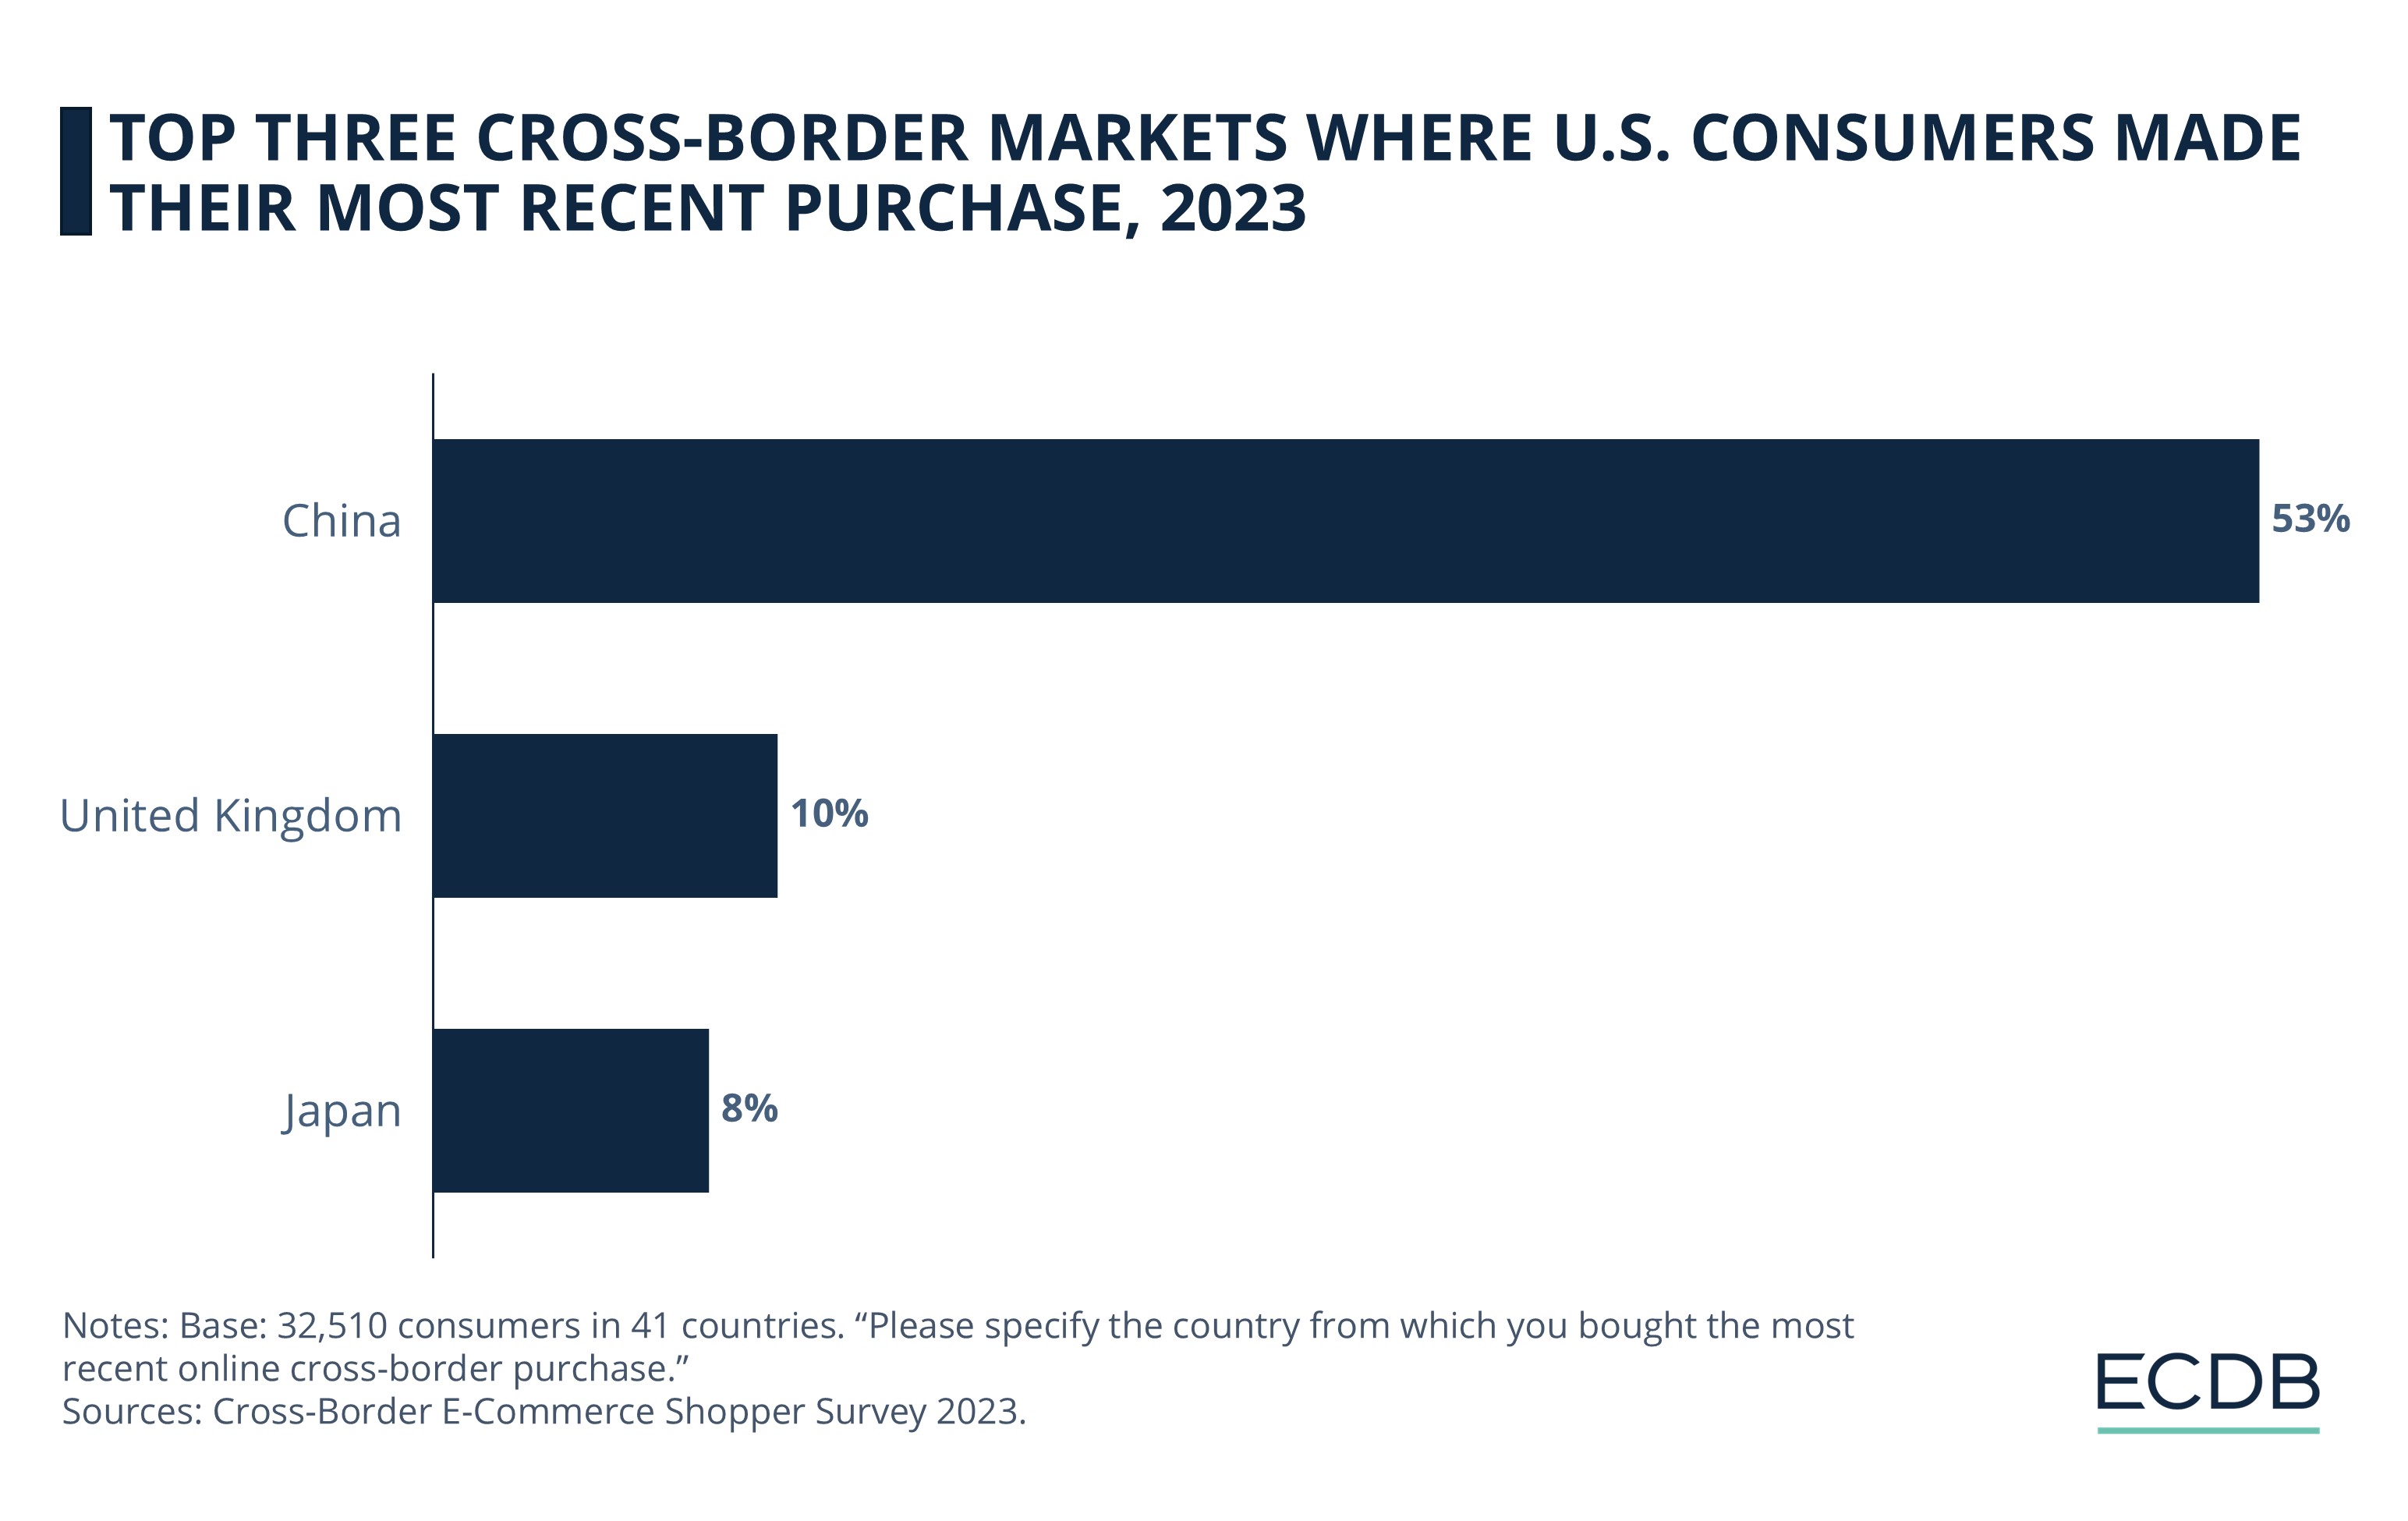
When asked where they made their most recent cross-border online purchase, U.S. consumers chose three countries:
China is the top choice of U.S. cross-border shoppers by a large margin, with 53% of respondents having shopped there in 2023.
The UK follows far behind and takes the second place, with 10%.
Japan is third in popularity – 8% of U.S. respondents made their latest cross-border purchase there.
China’s popularity in cross-border eCommerce is undeniable. As our ECDB insight explains, China’s cross-border market is expanding consistently. In 2023, its eCommerce export GMV was valued at US$523.5 billion, with the U.S. being its third-largest market.
Which countries are the top destination markets for the U.S.?
Destination Markets: Canadians and Mexicans Shop the Most in the U.S.
eCommerce retailers and marketplaces in the United States cater to diverse markets. As the data shows, its cross-border consumers are based in North America, Asia, Latin America and beyond.
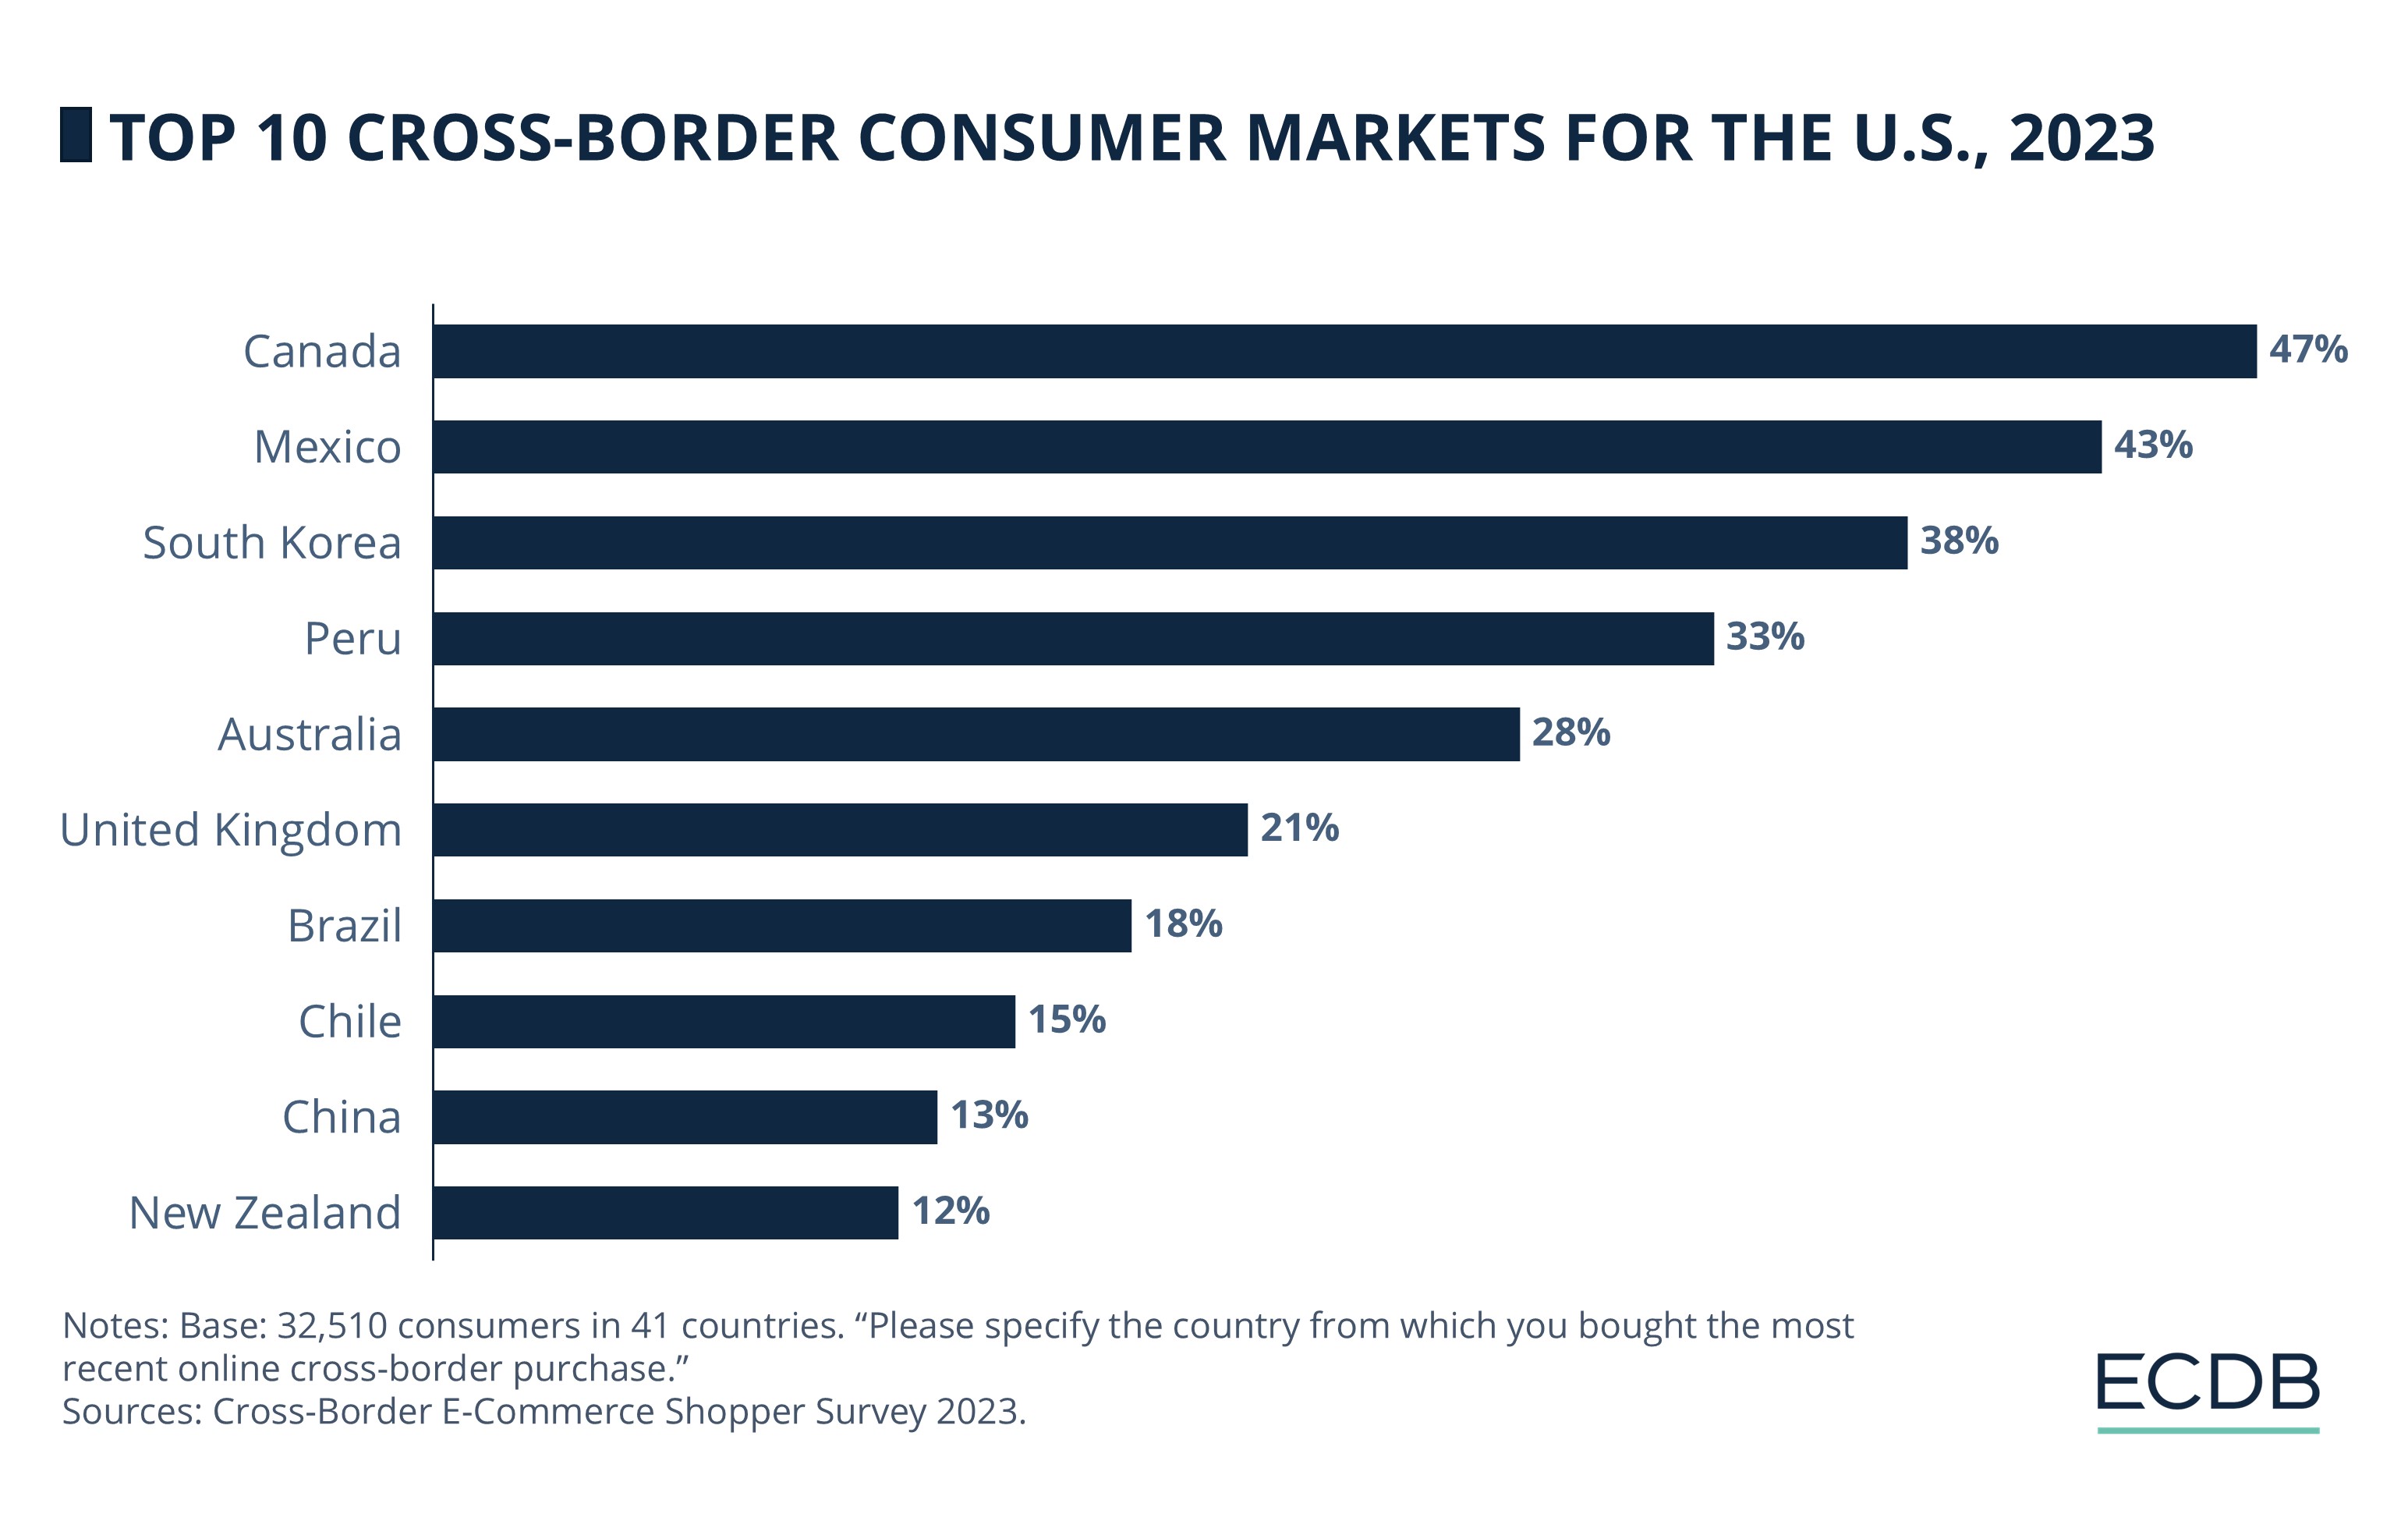
Consumers from the below countries made their most recent cross-border online purchase in the United States:
North American countries top the list, likely due to geographical proximity. Canada leads with 47%, followed by Mexico at 32%.
At 38%, South Koreans rank third on the list.
Latin American countries on the list include Peru, which is fourth with 33%. Brazil (18%) and Chile (15%) rank seventh and eighth.
Australia (28%) and the UK (21%) rank fifth and sixth.
China ranks well below others, at the ninth position. Only 13% of Chinese consumers said they last shopped cross-border in the U.S. in 2023.
ECDB data also underlines the role that Canada and Mexico play in U.S. cross-border eCommerce. Canada alone accounts for 80% of the country’s total cross-border GMV, while Mexico is second with 11%.
However, findings also show that in many of these top U.S. consumers markets, China is beginning to take over.
The U.S. versus China: Which Is A More Popular Cross-Border eCommerce Market?
We took the top five markets for U.S. cross-border eCommerce and drew a comparison to China.
The results show that China has not only gained popularity in many of the leading U.S. cross-border destinations but also surpassed it in three out of its top five markets:
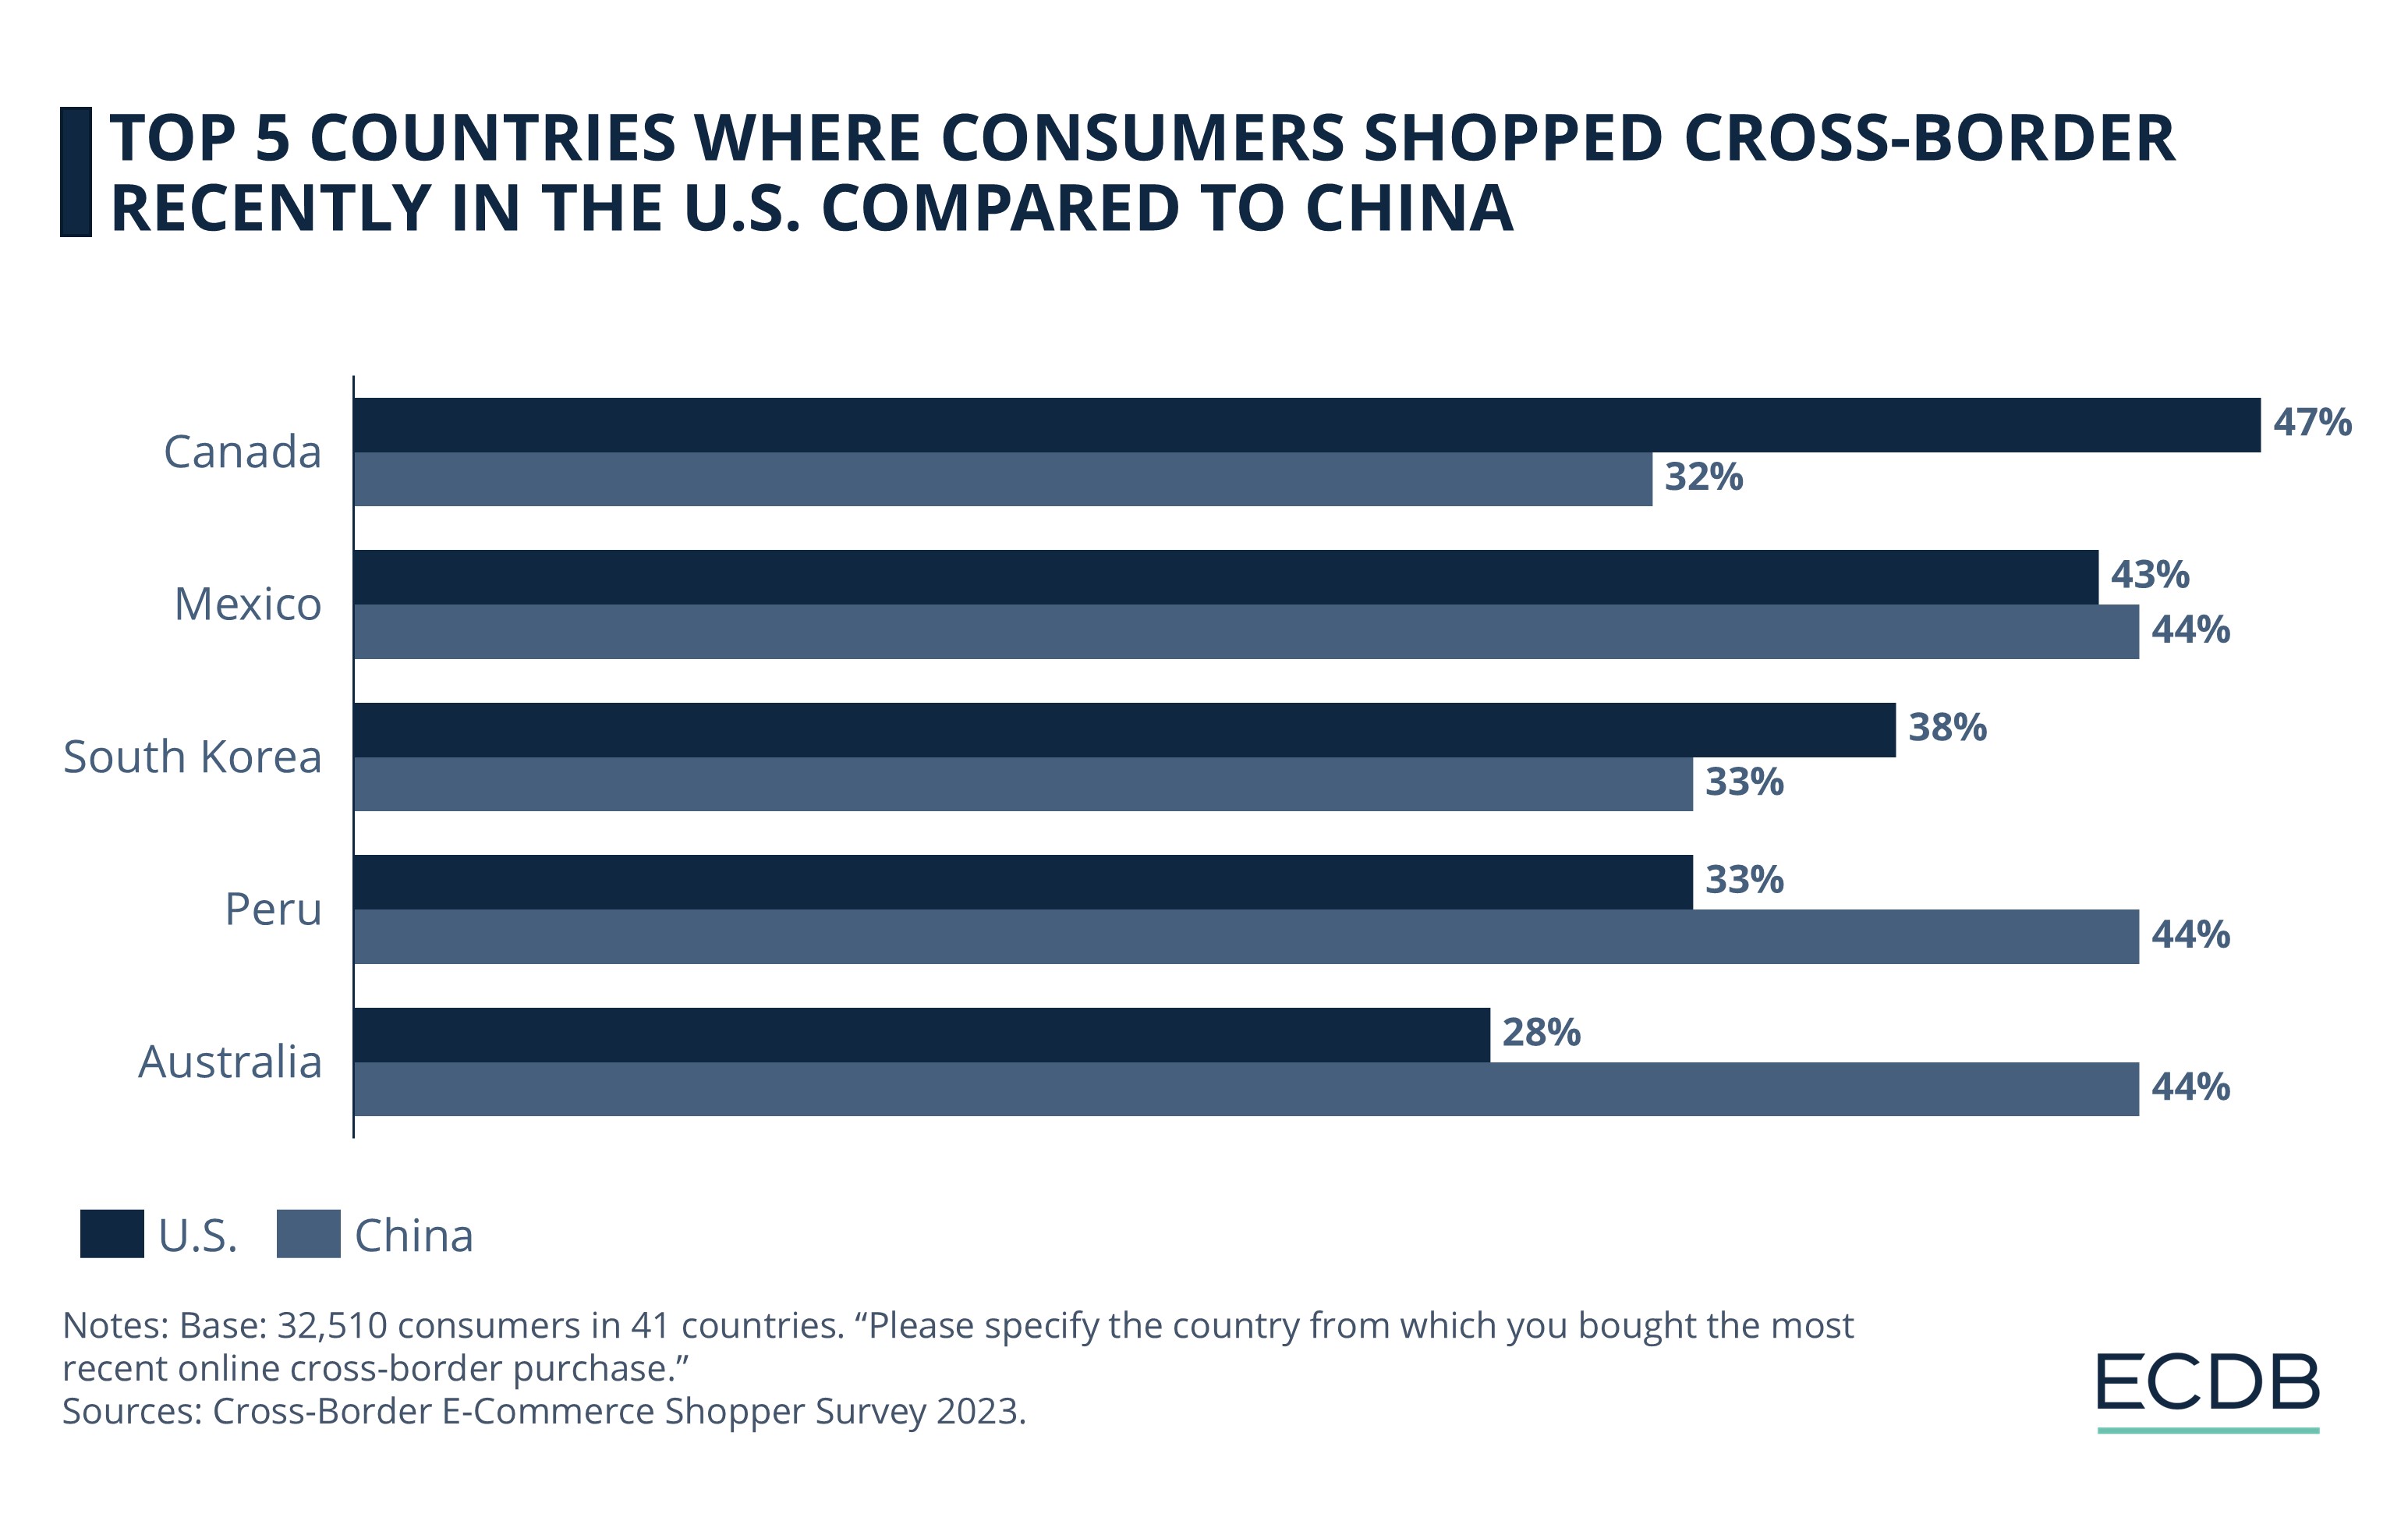
Canada remains a loyal market for the U.S. for now. The share of Canadian consumers choosing China (32%) is well below those who shopped from the U.S. (47%).
Mexico may be a popular consumer market for U.S. cross-border goods, but China has edged it out as their top choice. In 2023, 44% of Mexicans made their recent cross-border purchase from Chinese platforms compared to 43% who shopped from the U.S.
South Korea is the only other market on our list, apart from Canada, which still prefers the U.S. (38%) over China (33%) – but the difference is much smaller at only five percentage points.
Peru is the fourth most popular market for the U.S., but in 2023, more Peruvians shopped online from China (44%) than from the U.S. (33%).
Australia shows the same pattern, with the gap even larger: 44% of Australian respondents shopped from China as opposed to 28% who shopped from the U.S.
The source further indicates that China’s hold over many cross-border consumers is strengthening. For instance, in South Korea, the share of consumers who shopped recently from China increased by 3% or more since 2021, while it deceased at the same rate for the U.S. Other markets to see the same trend are Japan, Mexico, and Chile.
Further countries where China’s popularity has increased since 2021 are the U.S., Brazil, Australia, and European markets including Germany, the UK, Ireland, and Sweden.
U.S. Cross-Border eCommerce: Closing Remarks
Data on cross-border import-export volume confirms: domestic eCommerce players in the U.S. are still very strong. While the country’s import GMV has increased in recent years, it is nowhere close to the export value. It may further decrease with the U.S. government all but ready to change its de minimis rule.
Despite the large export volume, in global cross-border eCommerce, the U.S. is eclipsed by China, whose appeal continues to grow among international consumers. A combination of supportive policies, financing, and the construction of cross-border eCommerce pilot zones have empowered Chinese platforms like Miravia and Temu to rapidly capture new global markets.
Per recent news, U.S. retailers are now taking steps to retain control over their foreign customers. For instance, eCommerce giant Amazon is set to launch a discount segment to counter Temu. But for long-term cross-border success, the key lies not in stopgap measures but a wholistic strategy, which must include not just pricing but also quality, localization, and advanced logistics and fulfillment.
Sources: Statista: 1, 2, 3; ECDB; Taipei Times; Science Direct.
Click here for
more relevant insights from
our partner Mastercard.
Related insights
Deep Dive
Factors That Impact U.S. Holiday Shopping in 2024: Election, Deals, Weather, Number of Days
Factors That Impact U.S. Holiday Shopping in 2024: Election, Deals, Weather, Number of Days
Deep Dive
Fanatics Launches New NHL Collection in Cooperation with Lululemon
Fanatics Launches New NHL Collection in Cooperation with Lululemon
Deep Dive
Walmart Introduces Prescription Deliveries, Outpacing Drugstores CVS and Walgreens
Walmart Introduces Prescription Deliveries, Outpacing Drugstores CVS and Walgreens
Deep Dive
Online Shopping in the United States: Where Consumers Prefer to Shop Online
Online Shopping in the United States: Where Consumers Prefer to Shop Online
Deep Dive
Consumer Confidence Index (CCI) in the United States: eCommerce Analysis
Consumer Confidence Index (CCI) in the United States: eCommerce Analysis
Back to main topics