eCommerce: Consumer Confidence
Consumer Confidence Index (CCI) in the United States: eCommerce Analysis
How does the Consumer Confidence Index (CCI) impact eCommerce? Evaluating CCI insights with our own data, we look at trends and identify shifts in spending patterns.
Article by Cihan Uzunoglu | October 16, 2024Download
Coming soon
Share

Consumer Confidence Index (CCI) in the United States:
Key Insights
Consumer Confidence Index (CCI): A vital economic indicator that measures how consumers feel about the economy and their financial situation, CCI provides businesses and policymakers with insights into potential spending trends based on consumer optimism or pessimism.
Consumer Confidence and eCommerce Trends: Dips in consumer confidence so far this year have generally led to declines in eCommerce sales, but improvements in confidence haven't always translated into higher spending, as inflation and other factors continue to affect purchasing decisions.
Economic Forces Shaping Spending: Inflation, interest rates, and income shifts have significantly affected eCommerce behavior, driving consumers toward essential goods during uncertainty and leading them to rely on Buy Now, Pay Later (BNPL) options for larger purchases.
Consumer Outlook and Spending Patterns: The Present Situation and Expectations Indexes show that while consumers felt stable about their current conditions early in the year, growing pessimism about future prospects led to reduced discretionary spending.
How do we decide whether to spend or save? And what impact does this have on industries like eCommerce, where daily sales are tied to shifting economic moods?
Throughout 2024, consumer confidence has been both a driver and a reflection of changing spending habits. From big-ticket items to everyday purchases, economic sentiment has played a role in pushing online revenues up and down, influenced by everything from inflation to job stability.
But what exactly is the Consumer Confidence Index, and how does it shape how consumers approach their spending decisions?
What is Consumer Confidence Index (CCI)?
The Consumer Confidence Index (CCI) is a key economic indicator that measures how optimistic or pessimistic consumers feel about the overall state of the economy and their personal financial situation. It is based on a monthly survey conducted by The Conference Board, where a representative sample of households in the U.S. is asked about their perceptions of current economic conditions, as well as their expectations for the future.
The CCI reflects consumer sentiment on topics like employment, income, and business conditions, and is used by businesses, policymakers, and investors to gauge consumer spending trends, which is a significant driver of economic activity. A high CCI indicates confidence in the economy, while a low CCI suggests concerns or uncertainty.
Consumer Confidence and eCommerce Revenue in the U.S: Monthly Trends in 2024
How is CCI relevant to the eCommerce market? Simply put, the relationship between eCommerce revenue changes and shifts in consumer confidence reveals how economic sentiment affects online shopping behavior.
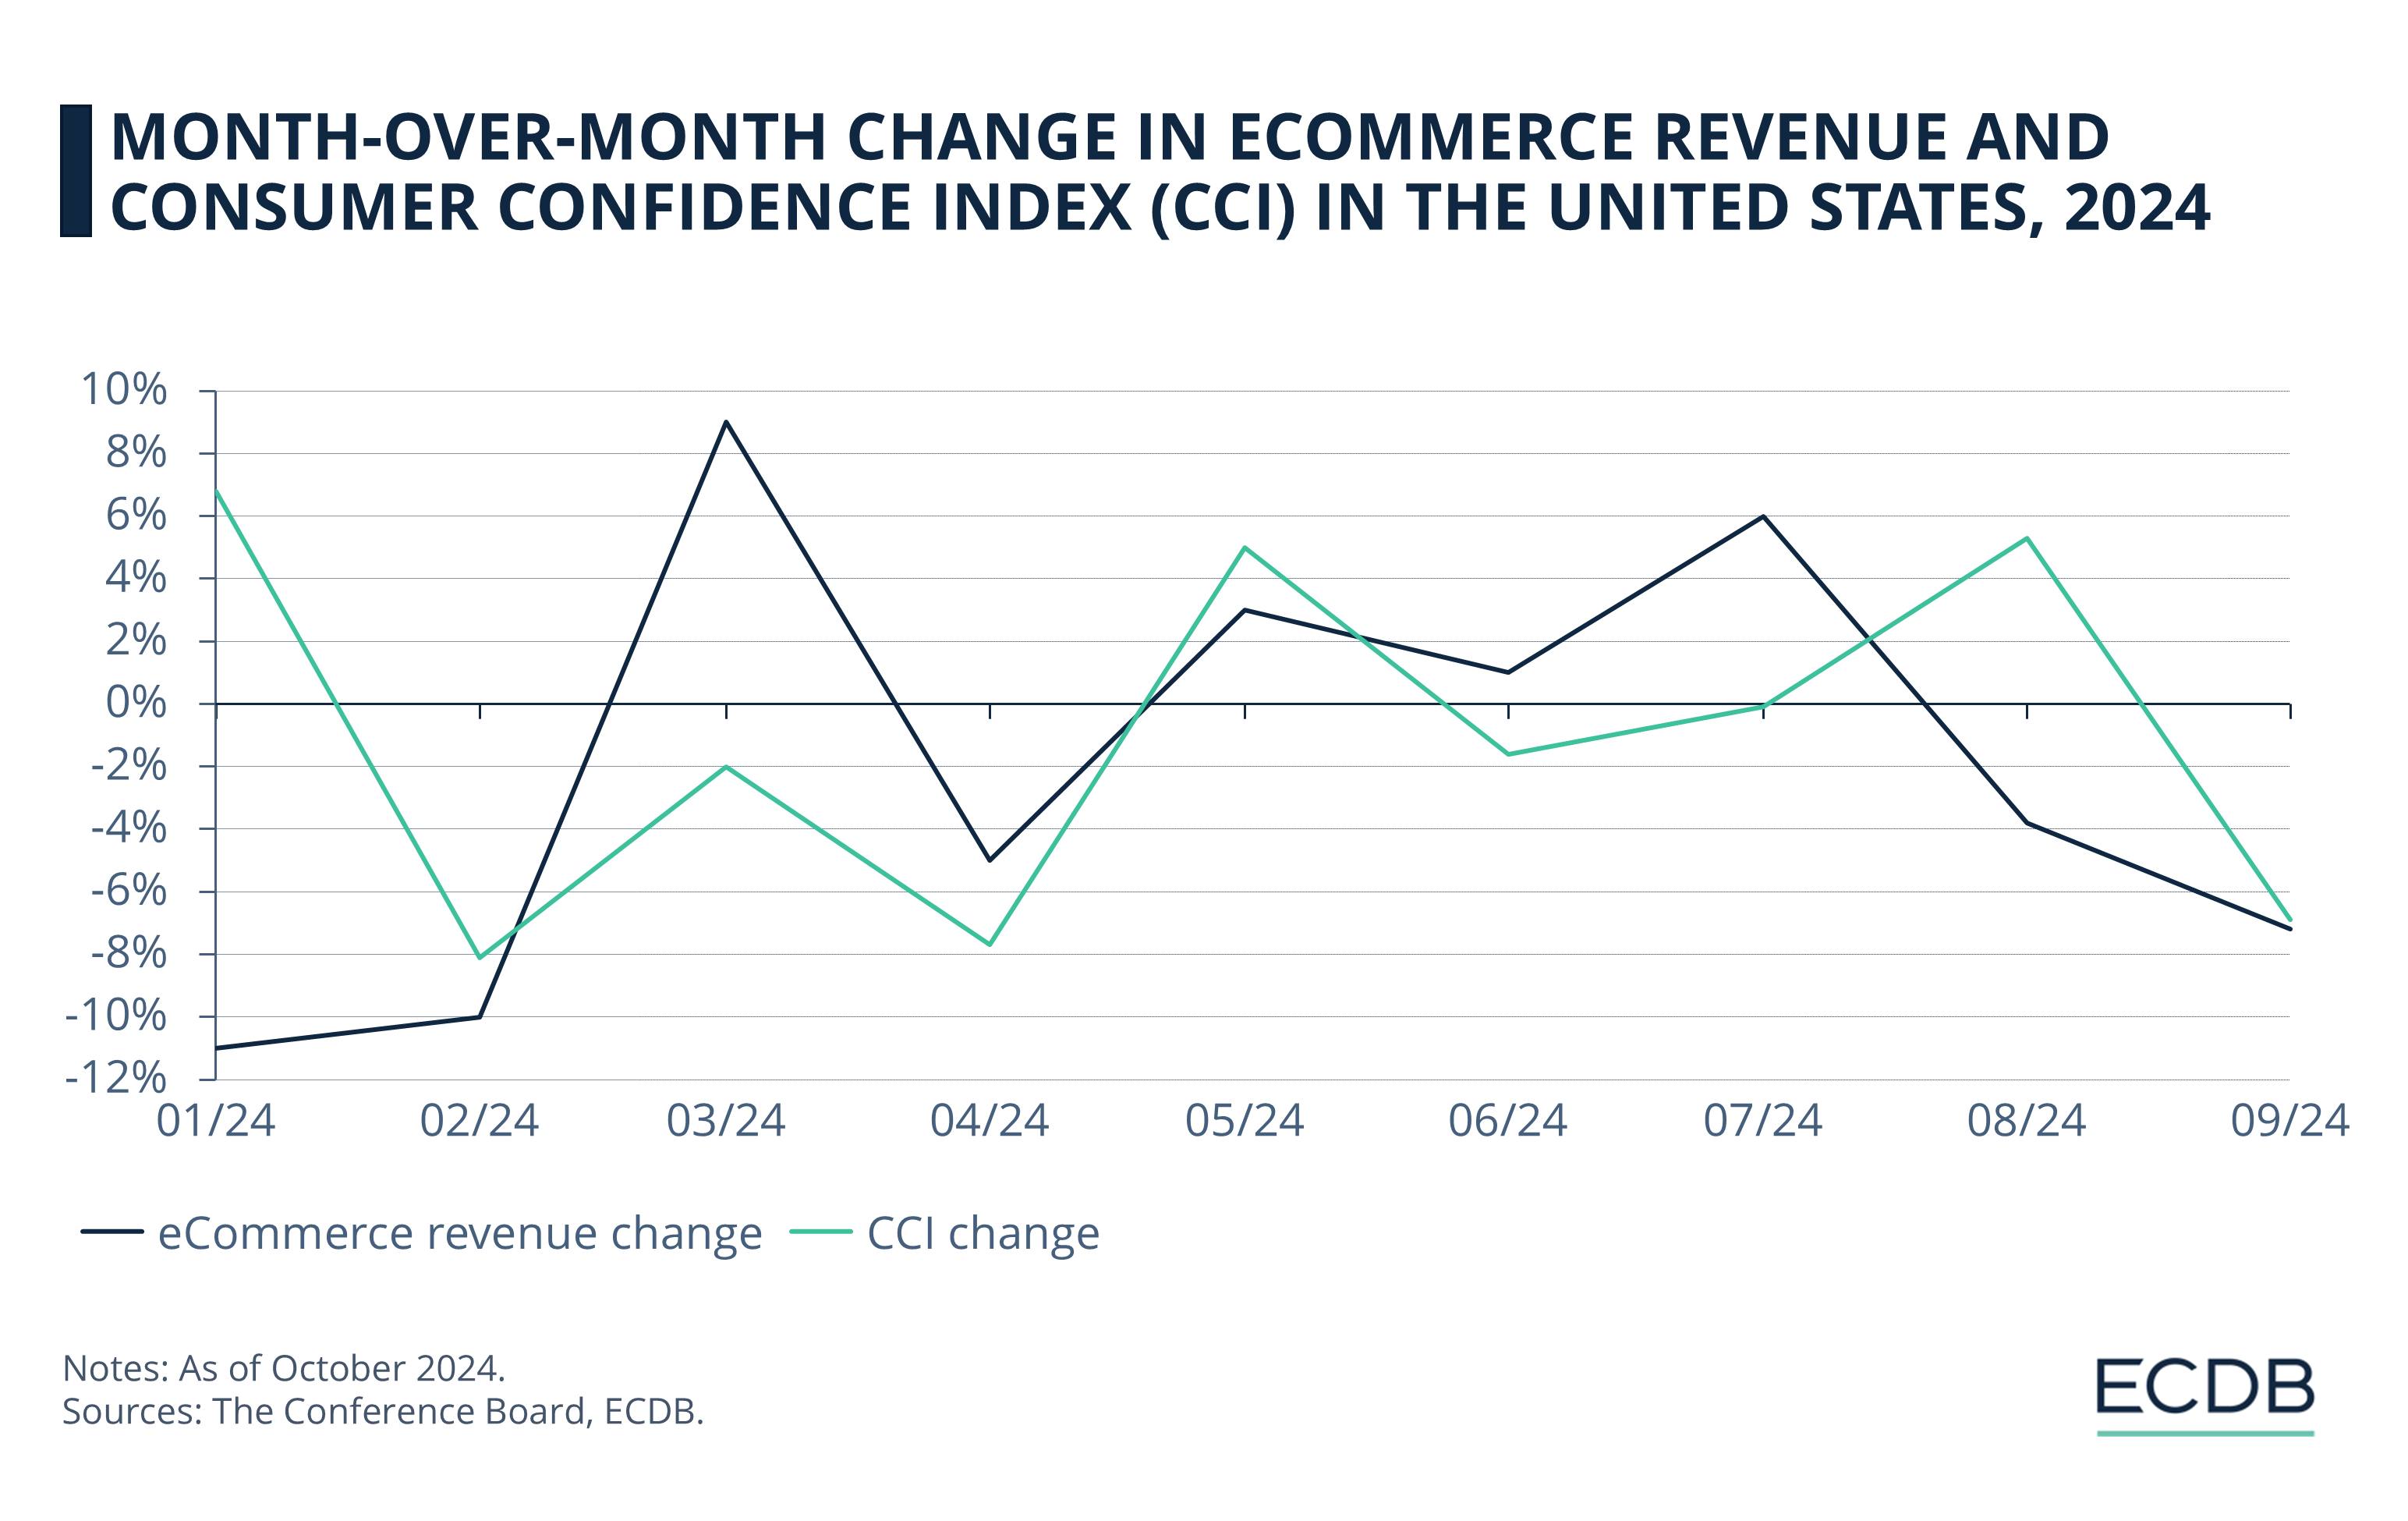
By comparing our data on month-over-month changes in U.S. eCommerce revenue with The Conference Board's CCI data, we identify certain key patterns in consumer spending and confidence throughout 2024:

Confidence Dips Lead to Revenue Drops: In February and April 2024, significant drops in CCI (-8% each time) were followed by declines in eCommerce revenue (-10% and -5%, respectively). The learning here is that when consumers are uncertain about the economy, they reduce online shopping, especially for non-essential items.
Increased Confidence Does Not Always Translate to Revenue Gains: May and August 2024 saw positive CCI changes (+5%), but the corresponding impact on eCommerce revenue was mixed (+3% in May, but -4% in August). While consumer sentiment might improve, other factors like inflation or pricing could still hold back online spending.
Moderate Confidence Shifts, Strong Revenue Recovery: Despite smaller movements in CCI from March to July, eCommerce revenue rebounded. For example, March saw only a -2% change in CCI but a +9% increase in revenue. Even when confidence is uncertain, online spending can recover when consumers find deals, promotions, or essentials that fit their needs.
Below are some additional insights into how these trends are shaped by broader economic factors, including inflation, interest rates, and demographic spending shifts.
1. Impact of Consumer Confidence
on eCommerce Spending
Consumer sentiment fluctuates based on job market stability, inflation, and income expectations, all of which directly influence online shopping behavior.
When confidence rose in January 2024 (+6.8 points), for instance, people were more likely to spend on non-essentials. Dips in confidence from February to April, on the other hand, meant reduced discretionary spending. eCommerce platforms have adapted to this by pushing discounts or financing, especially for big-ticket items.
2. Price Sensitivity and Inflation
Inflation concerns have dominated consumer worries throughout 2024, affecting online purchasing patterns. As inflation rose, consumers shifted spending to essentials like groceries and household goods, while cutting back on luxury or non-essential online purchases.
eCommerce platforms that cater to price-sensitive shoppers, especially those offering price comparisons or loyalty programs, saw more activity during these months. Consumers have also relied on promotions and seasonal sales events like Amazon Prime Day.

3. Interest Rates and Payment Options in eCommerce
As interest rates fluctuate this year, consumers are turning to Buy Now, Pay Later (BNPL) options for large online purchases such as electronics or furniture. When confidence and income expectations drop, consumers tend to avoid large upfront payments.
eCommerce platforms with BNPL and other financing options benefit from this situation, especially in the months when confidence drops and interest rate concerns rise.
4. Discretionary vs. Non-Discretionary Spending Shifts
During periods of declining confidence (especially April and May), consumers prioritized non-discretionary spending on health, utilities, and groceries, reducing spending on entertainment, vacations, and fashion.
Stay Informed: Our rankings are continuously updated with the newest data from our models, offering valuable insights to enhance your business strategy. Curious about which stores and companies are at the forefront of eCommerce? Want to know which categories are leading in sales and popularity? Discover the answers in our rankings for companies, stores, and marketplaces. Keep ahead of the competition with ECDB.
However, demand for digital services such as streaming or online learning grew. This trend favored platforms offering digital subscriptions or essential goods, while hurting luxury and travel-focused eCommerce.
5. Demographic Trends: Age, Income, and Online Shopping
Finally, younger consumers (under 35) remained the most confident this year, continuing to spend on social commerce platforms, mobile apps and fashion. To no one's surprise, high-income groups were the most resilient, maintaining luxury and premium purchases even as confidence waned.
Meanwhile, lower-income groups pulled back on discretionary spending. eCommerce platforms that targeted younger and high-income groups with personalized offers or exclusive products stayed ahead during periods of low consumer sentiment.
United States Consumer Behavior:
Present Situation and Expectations
In addition to CCI, it is important to read these developments with the help of two other important metrics: Present Situation Index and Expectations Index.
As measures of consumers' assessment of current business and labor market conditions, as well as short-term outlook for income and business, these indexes offer important insights into how broader economic conditions influence eCommerce:

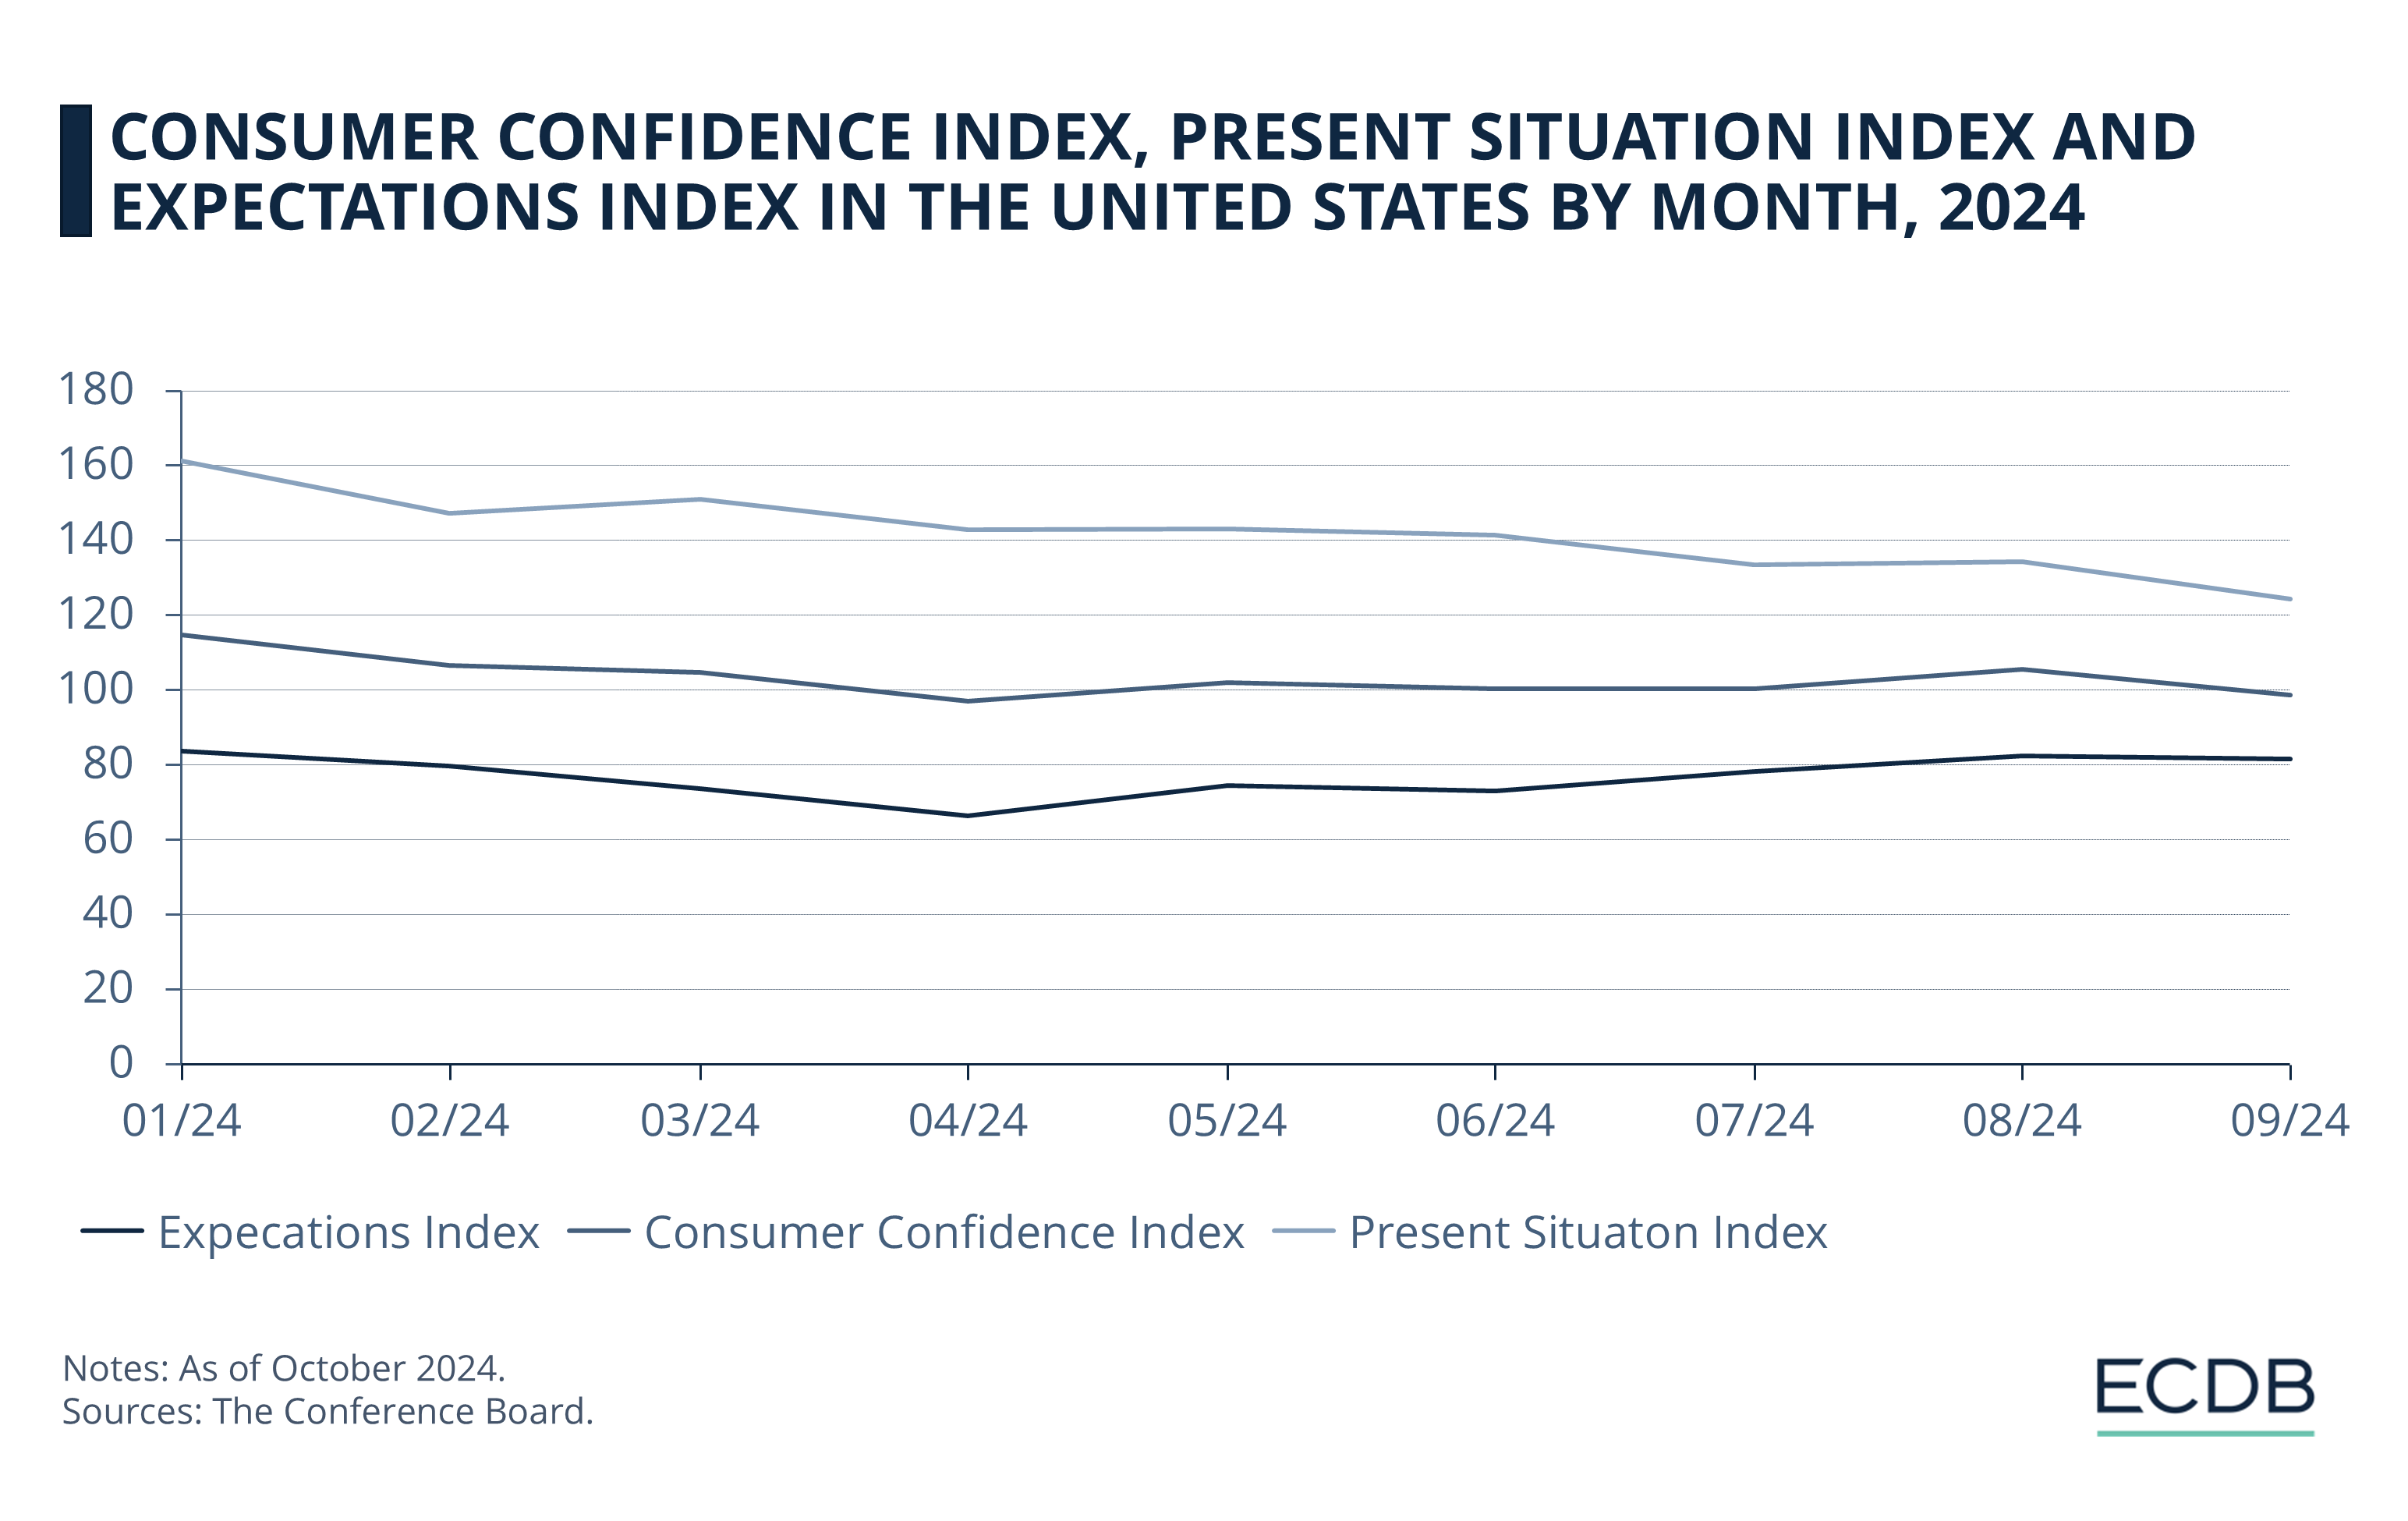
Divergence Between Current Conditions and Future Expectations: From January to April, the Present Situation Index stayed relatively high (161.3 to 142.9), while the Expectations Index dropped significantly (from 83.8 to 66.4). While consumers felt secure about their current finances, growing pessimism about the future led them to cut back on large, discretionary online purchases. As noted earlier, this is when eCommerce platforms began promoting financing options and discounts to maintain sales momentum.
Rebound in Expectations & Recovery in Online Spending: In May and August, we see a recovery in the Expectations Index (from 66.4 in April to 74.6 in May, and 82.5 in August). This period also coincides with increased eCommerce revenue, as discussed earlier, with May showing a +3% change in revenue and July and August seeing continued recovery.
Correlation Between Present Situation Index and eCommerce Revenue: From June to September, the Present Situation Index declined from 141.5 to 124.3. This weakening reflects a drop in consumer confidence about the current economy, which aligns with declines in eCommerce revenue during this period (-4% in August and -7% in September).
How CCI is Calculated
CCI is derived from a monthly survey conducted by The Conference Board, involving 3,000 U.S. households. Respondents provide their views on five key economic questions, covering both current conditions and their expectations for the next six months. These responses are then compiled into two sub-indices: the Present Situation Index and the Expectations Index.
The results are compared against a baseline set in 1985, which is assigned a value of 100. A CCI above 100 indicates higher optimism, typically associated with increased spending and reduced savings. Conversely, a score below 100 suggests economic pessimism, with consumers likely to hold back on purchases, especially non-essential items, and focus more on saving.
Limitations and Criticisms of the CCI
The CCI is often seen as a lagging indicator, reflecting changes after broader economic shifts have occurred. It relies on subjective survey responses, which don't always align with actual consumer behavior. External factors like political events or global crises can also heavily influence the index, making it more volatile.
Despite these criticisms, the CCI is still useful when combined with other economic data to understand broader consumer trends.
Sources: The Conference Board: 1, 2, 3, 4, 5, 6, 7, 8, 9, 10, ECDB

Click here for
more relevant insights from
our partner Mastercard.
Related insights
Deep Dive
European Retailers Return to Physical Stores to Compete with Online Giants
European Retailers Return to Physical Stores to Compete with Online Giants
Deep Dive
YouTube Partners With Flipkart and Myntra to Launch YouTube Shopping in India
YouTube Partners With Flipkart and Myntra to Launch YouTube Shopping in India
Deep Dive
Inflation's Impact on eCommerce
Inflation's Impact on eCommerce
Deep Dive
Older Consumers Drive Growth in the Chinese eCommerce Market
Older Consumers Drive Growth in the Chinese eCommerce Market
Deep Dive
Online Shopping in China: Where Chinese Consumers Shop Online
Online Shopping in China: Where Chinese Consumers Shop Online
Back to main topics
