eCommerce: Amazon
Amazon Prime Day 2024: Spending Increased From the Previous Year
Amazon Prime Day is undoubtedly one of the biggest discounting events. This year's event took place on July 16-17, and Adobe estimates that it generated approximately US$14 billion in the U.S. But what did consumer spending look like in more detail? Here are the Prime Day 2024 stats.
Article by Nadine Koutsou-Wehling | July 22, 2024
Amazon Prime Day 2024: Key Insights
Average Order Value and Household Spend: Most orders (67%) cost up to US$50 on average. The average order size was US$58.89, with households most likely placing just over two orders. This amounts to an average household spend of US$138, with most households paying more than US$100 this Prime Day.
Average Item Price and Most Popular Product Categories: 78% of items purchased cost up to US$30, with the average price being US$28.47. Fashion, Home Goods, and Household Essentials were the top categories this year.
Other Summer Sales Do Not Compare: Major discount events by competing retailers in the U.S. were Target Circle Week, Walmart Deals, and Best Buy Black Friday in July. But most Prime Day shoppers participated in no other sales events. Temu hosted an own event as well, with prices as low as US$1.
Another year, another summer, another Prime Day: This year’s discount event powered by Amazon was held in 22 countries from July 16 to 17. Every Prime member was offered deals on products in a variety of categories to promote Amazon Prime memberships and draw attention to the largest eCommerce retailer.
The phrase “Amazonization” of markets describes a general push toward consumer conveniences like fast delivery, wide assortments, and – lavish discount events. Meanwhile, other major retailers have launched their own versions of Prime Day, but can they hope to compete with the No. 1 in eCommerce, Amazon?
Valuable Insights: Our data-driven rankings are regularly refreshed to provide you with crucial insights for your business. Find out which stores and companies are performing will in the eCommerce space and which categories are topping the sales charts. Stay ahead of the market with our rankings for companies, stores, and marketplaces.
Prime Day 2024: Most Orders Up to US$50
Based on the Numerator’s Prime Day shopping surveys, the majority of orders (67%) were up to a value of US$50. Note that an order is likely to include more than one item, with the average order size being US$58.89 – and households placing just over two orders on average.
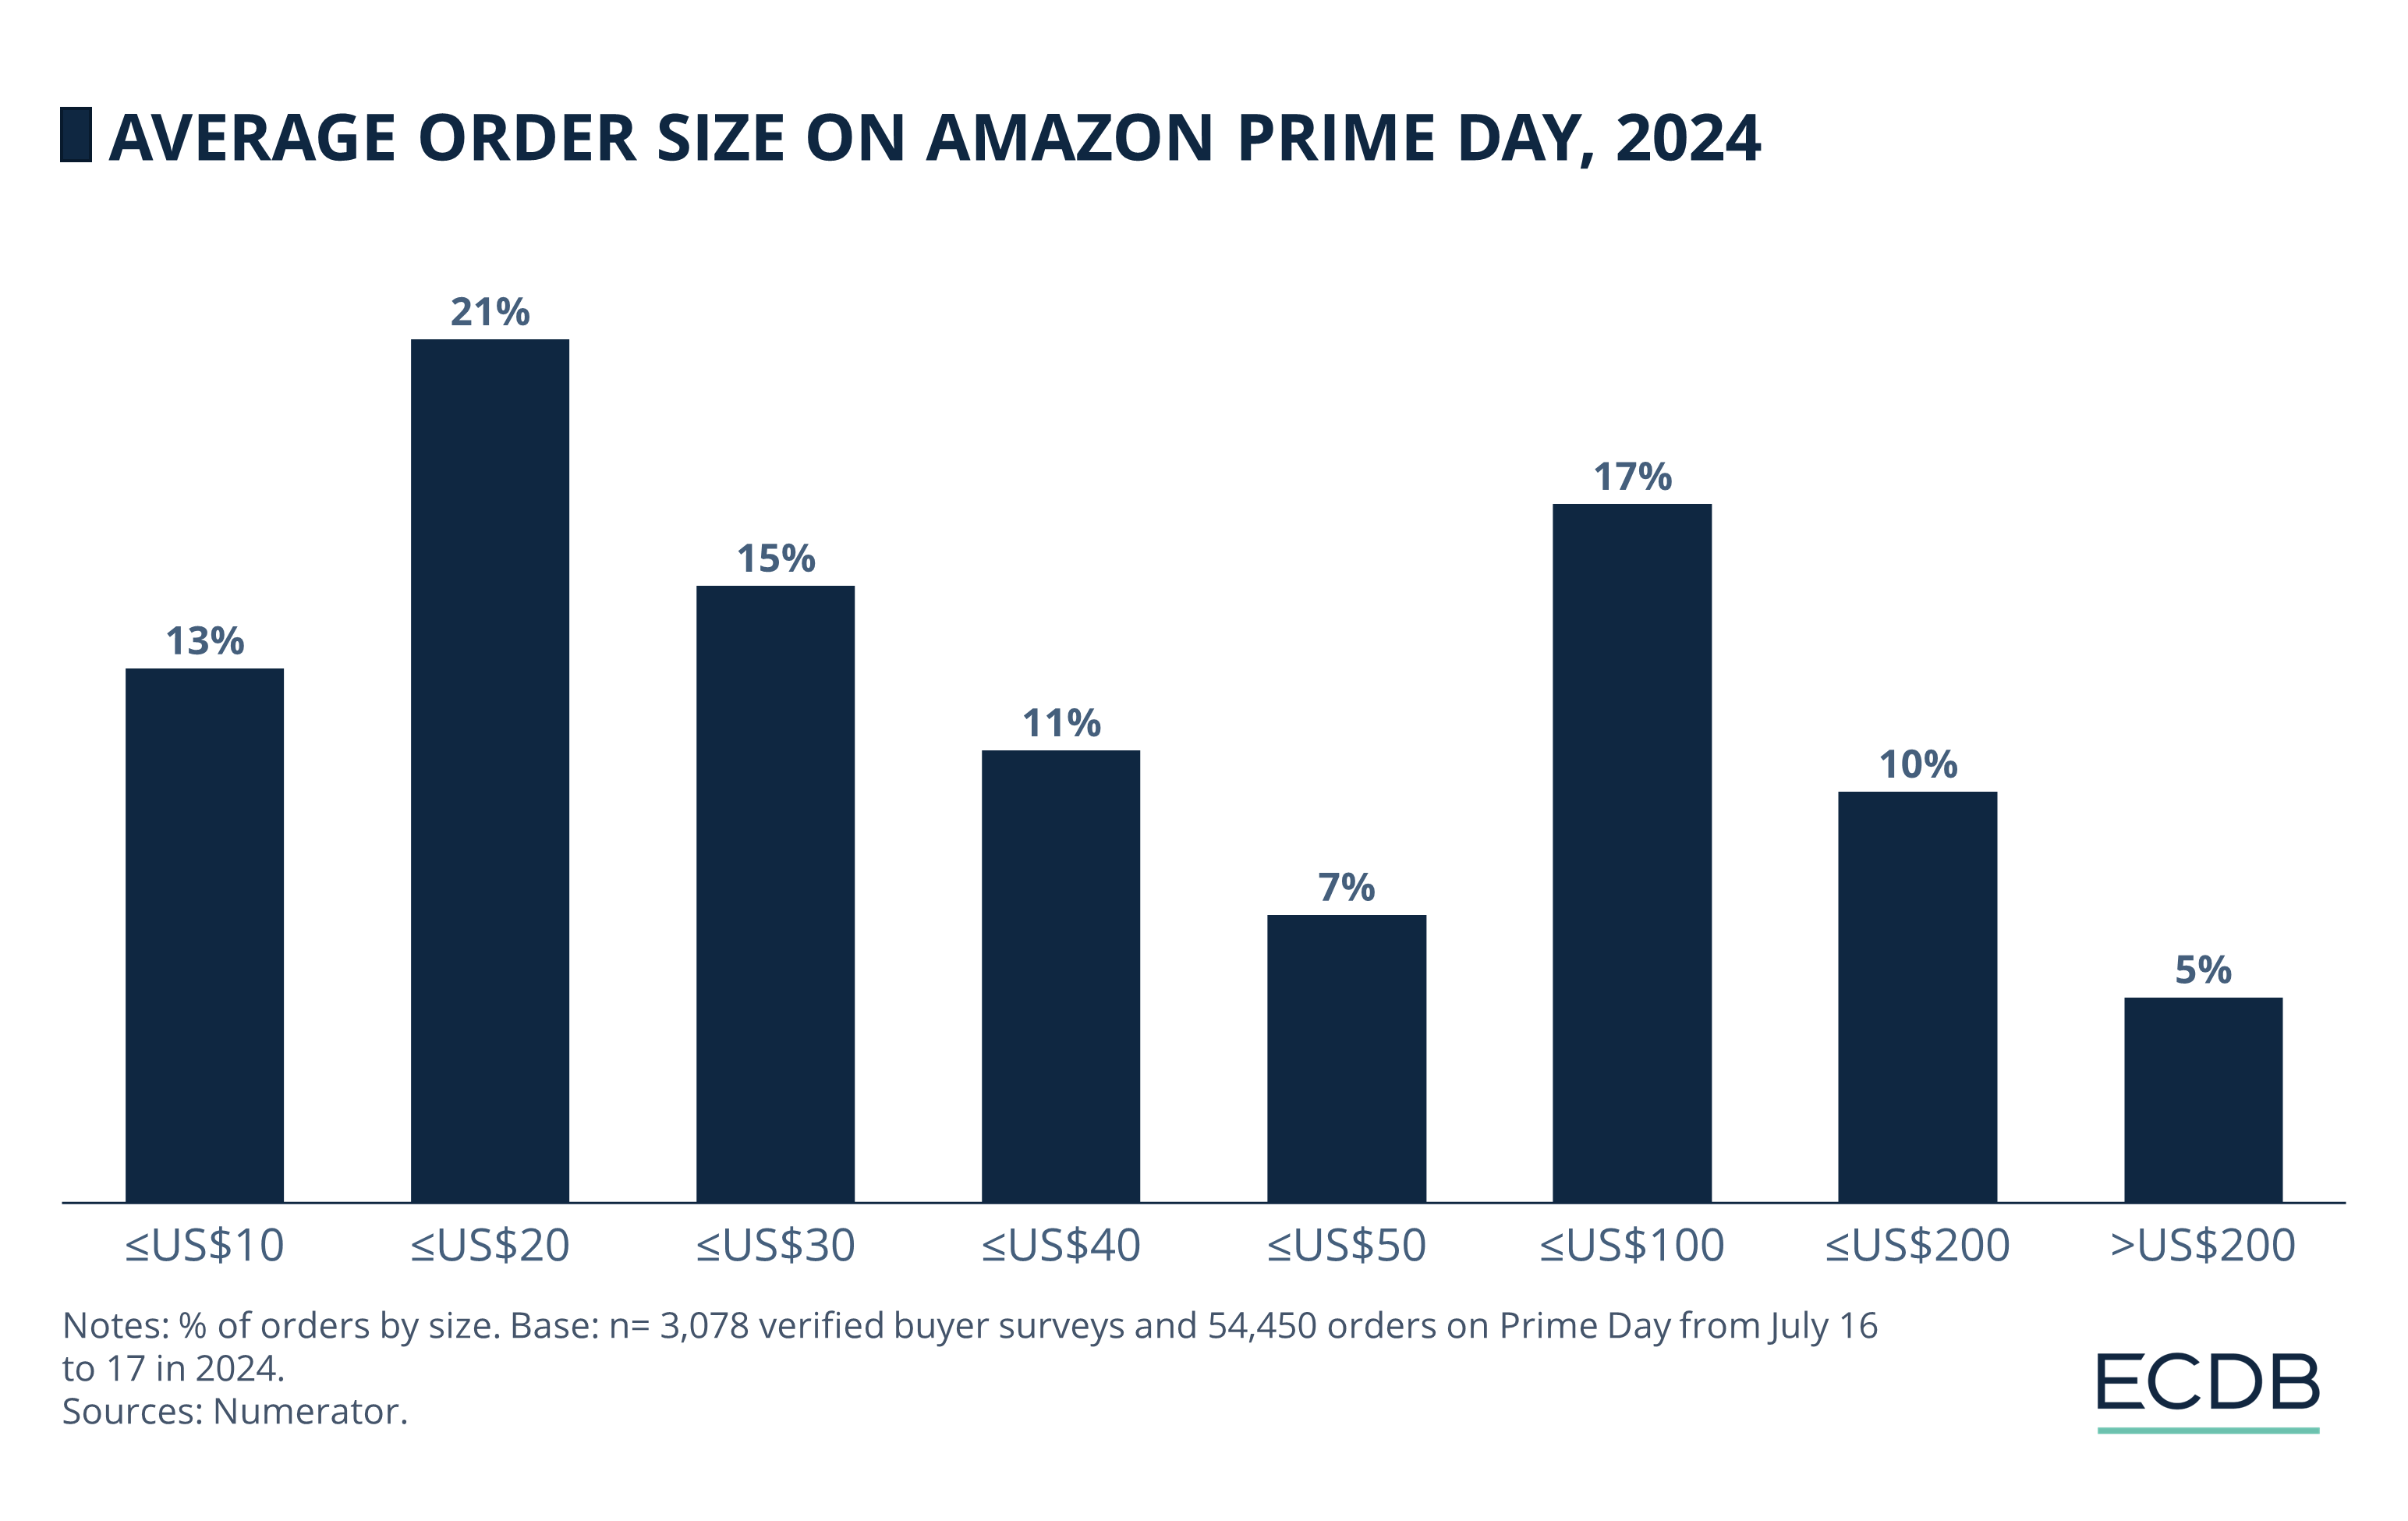
Most orders (21%) were between US$10 and US$20. Another likely range was between US$50 and US$100, this was the case for 17% of orders.
Less likely were very low orders of up to US$10 (13%), or between the ranges of US$20 and US$50.
Higher-priced orders were also rather unlikely, with 10% of orders between the US$100 to US$200 range, and only 5% of orders costing more than US$200.
How much did households spend on Prime Day this year?
Prime Day Spending: Average Household Spend Most Likely to Be Over US$100
The opposite is true for average household spending: A majority of 63% of households spent over US$100. Specifically, the average household spend in 2024 was US$138.
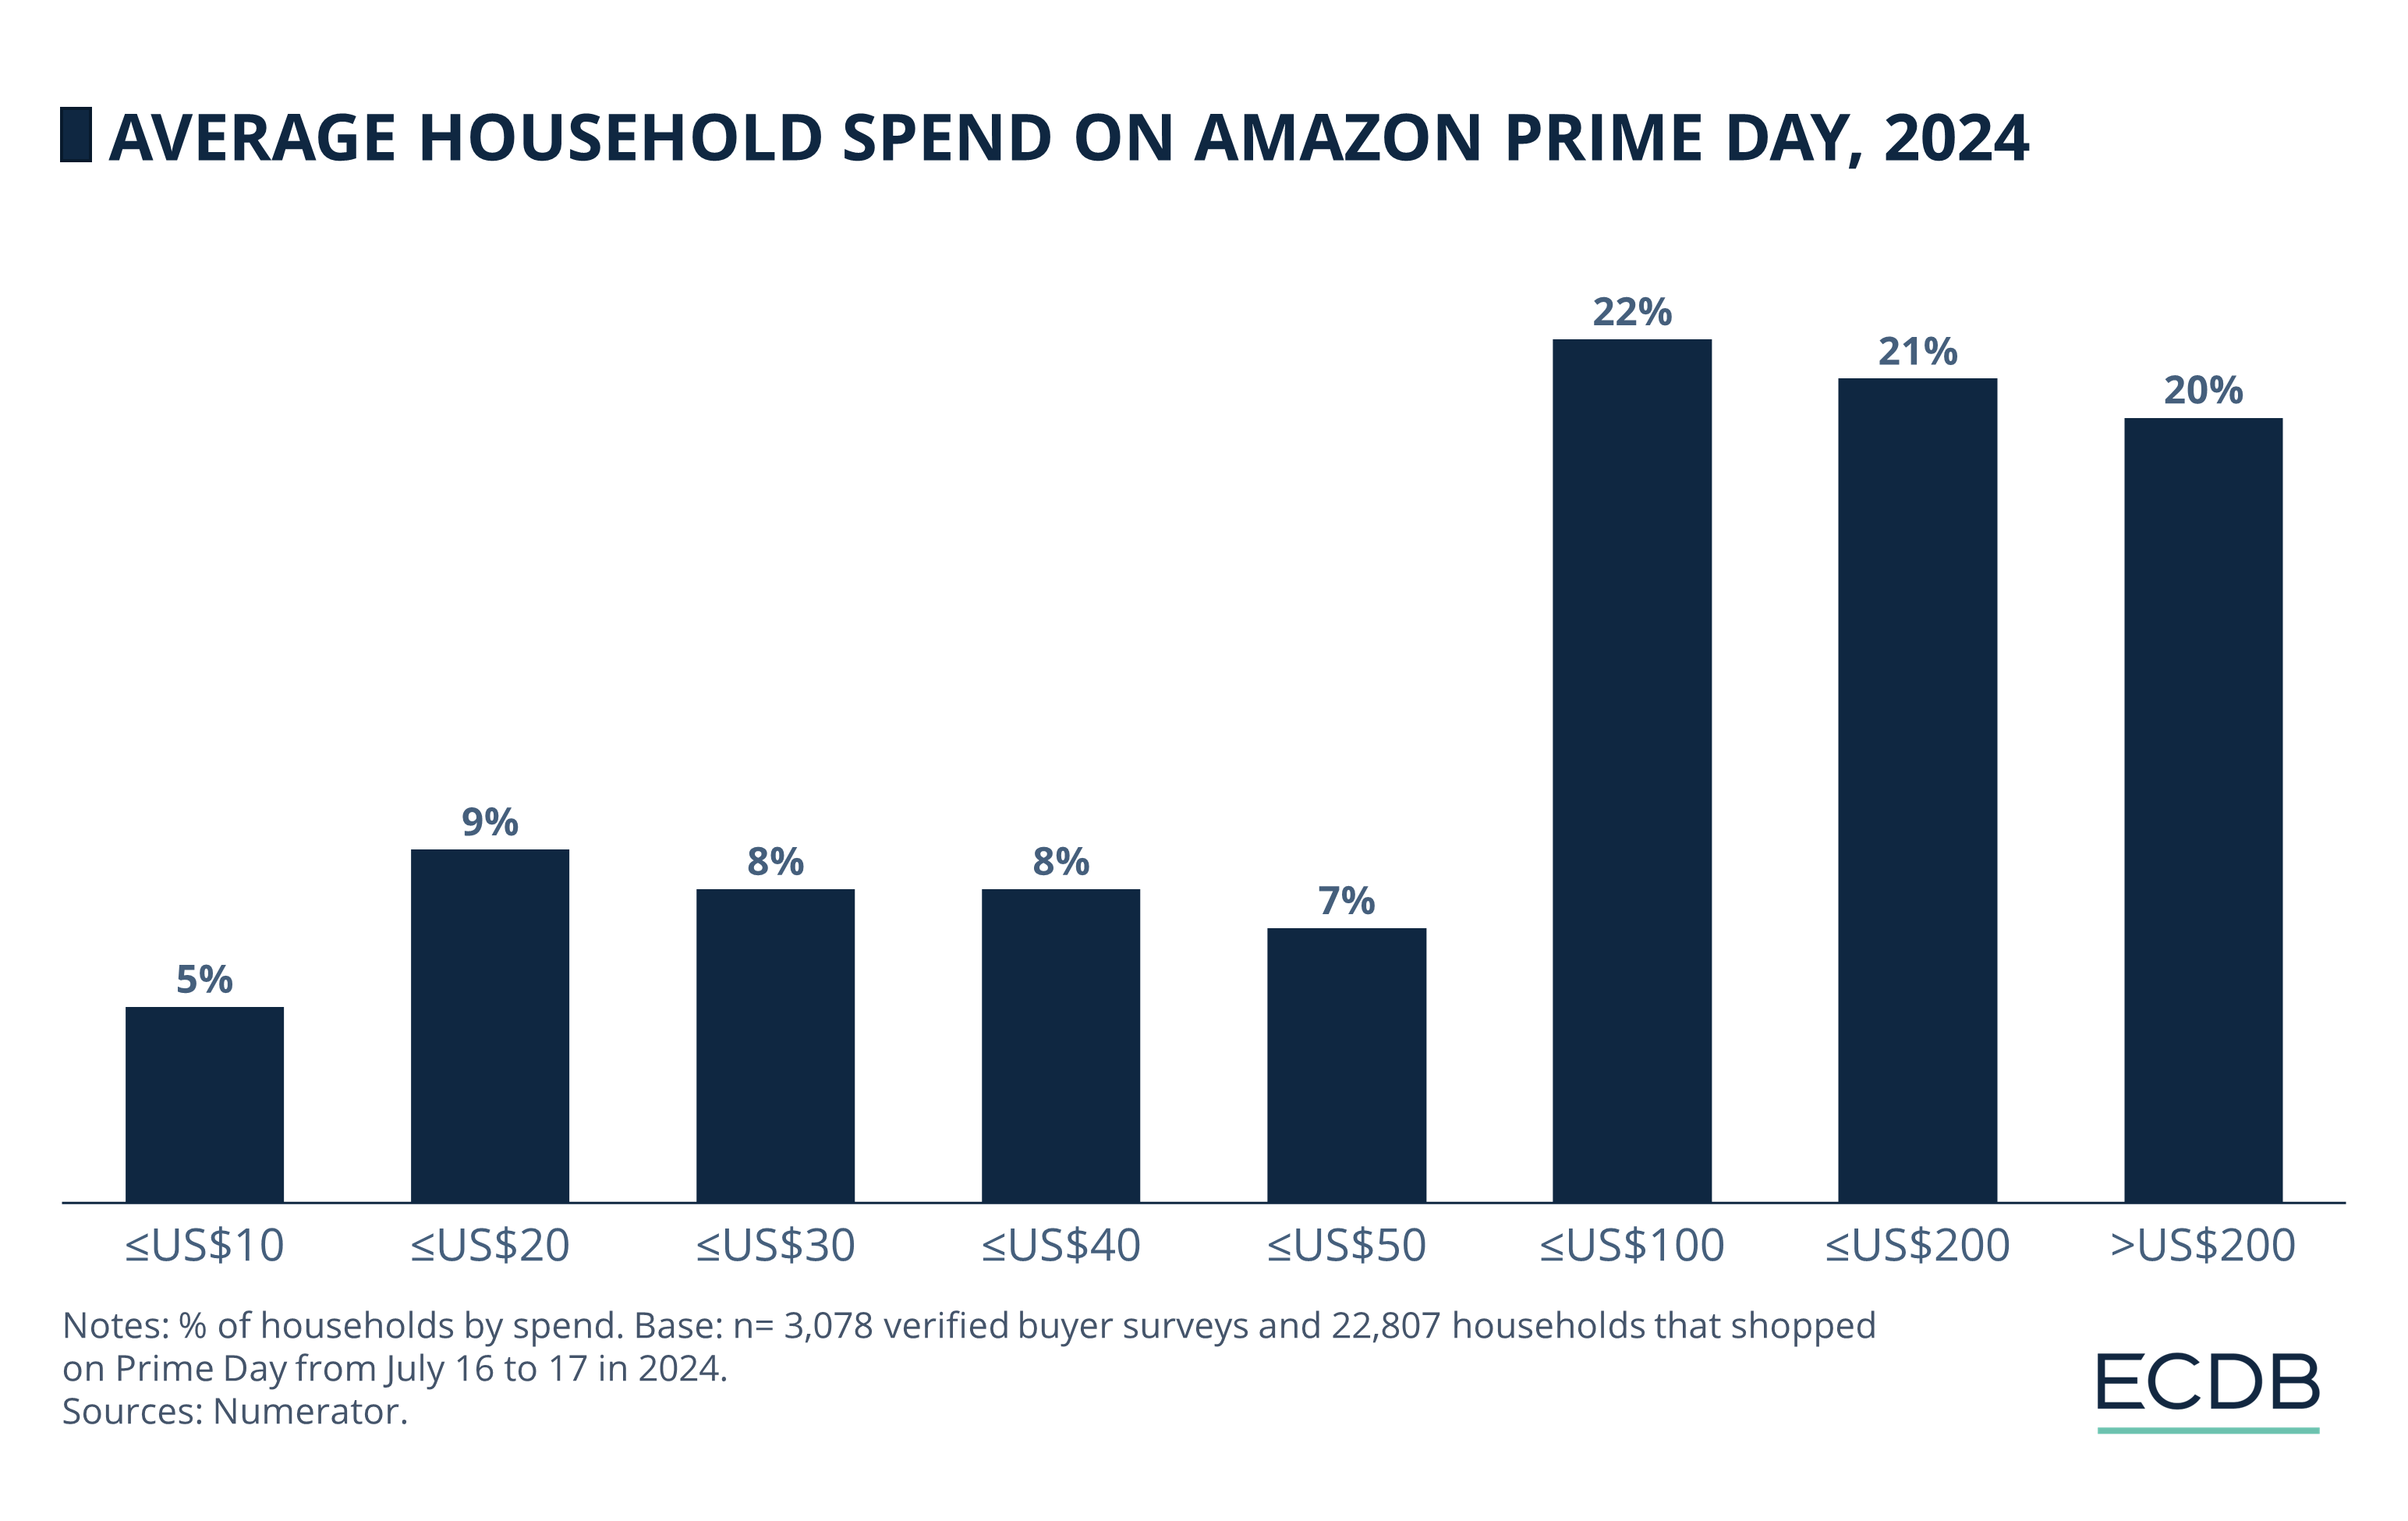
Most households (22%) spent between US$50 and US$100 this Prime Day. The next most likely ranges were between US$100 and US$200 (21%), and over US$200 (20%).
The lowest spending range of US$10 was the least likely. All price ranges below US$50 were ordered by no more than 9% of households.
What price ranges were most likely for items purchased on this year’s Prime Day?
Product Cost: Most Items Cost Between US$10 and US$50
When it comes to item prices, cheap wins the race: Prime members were looking to splurge on several lower-priced items, as confirmed here. The average item price was US$28.47 this year.
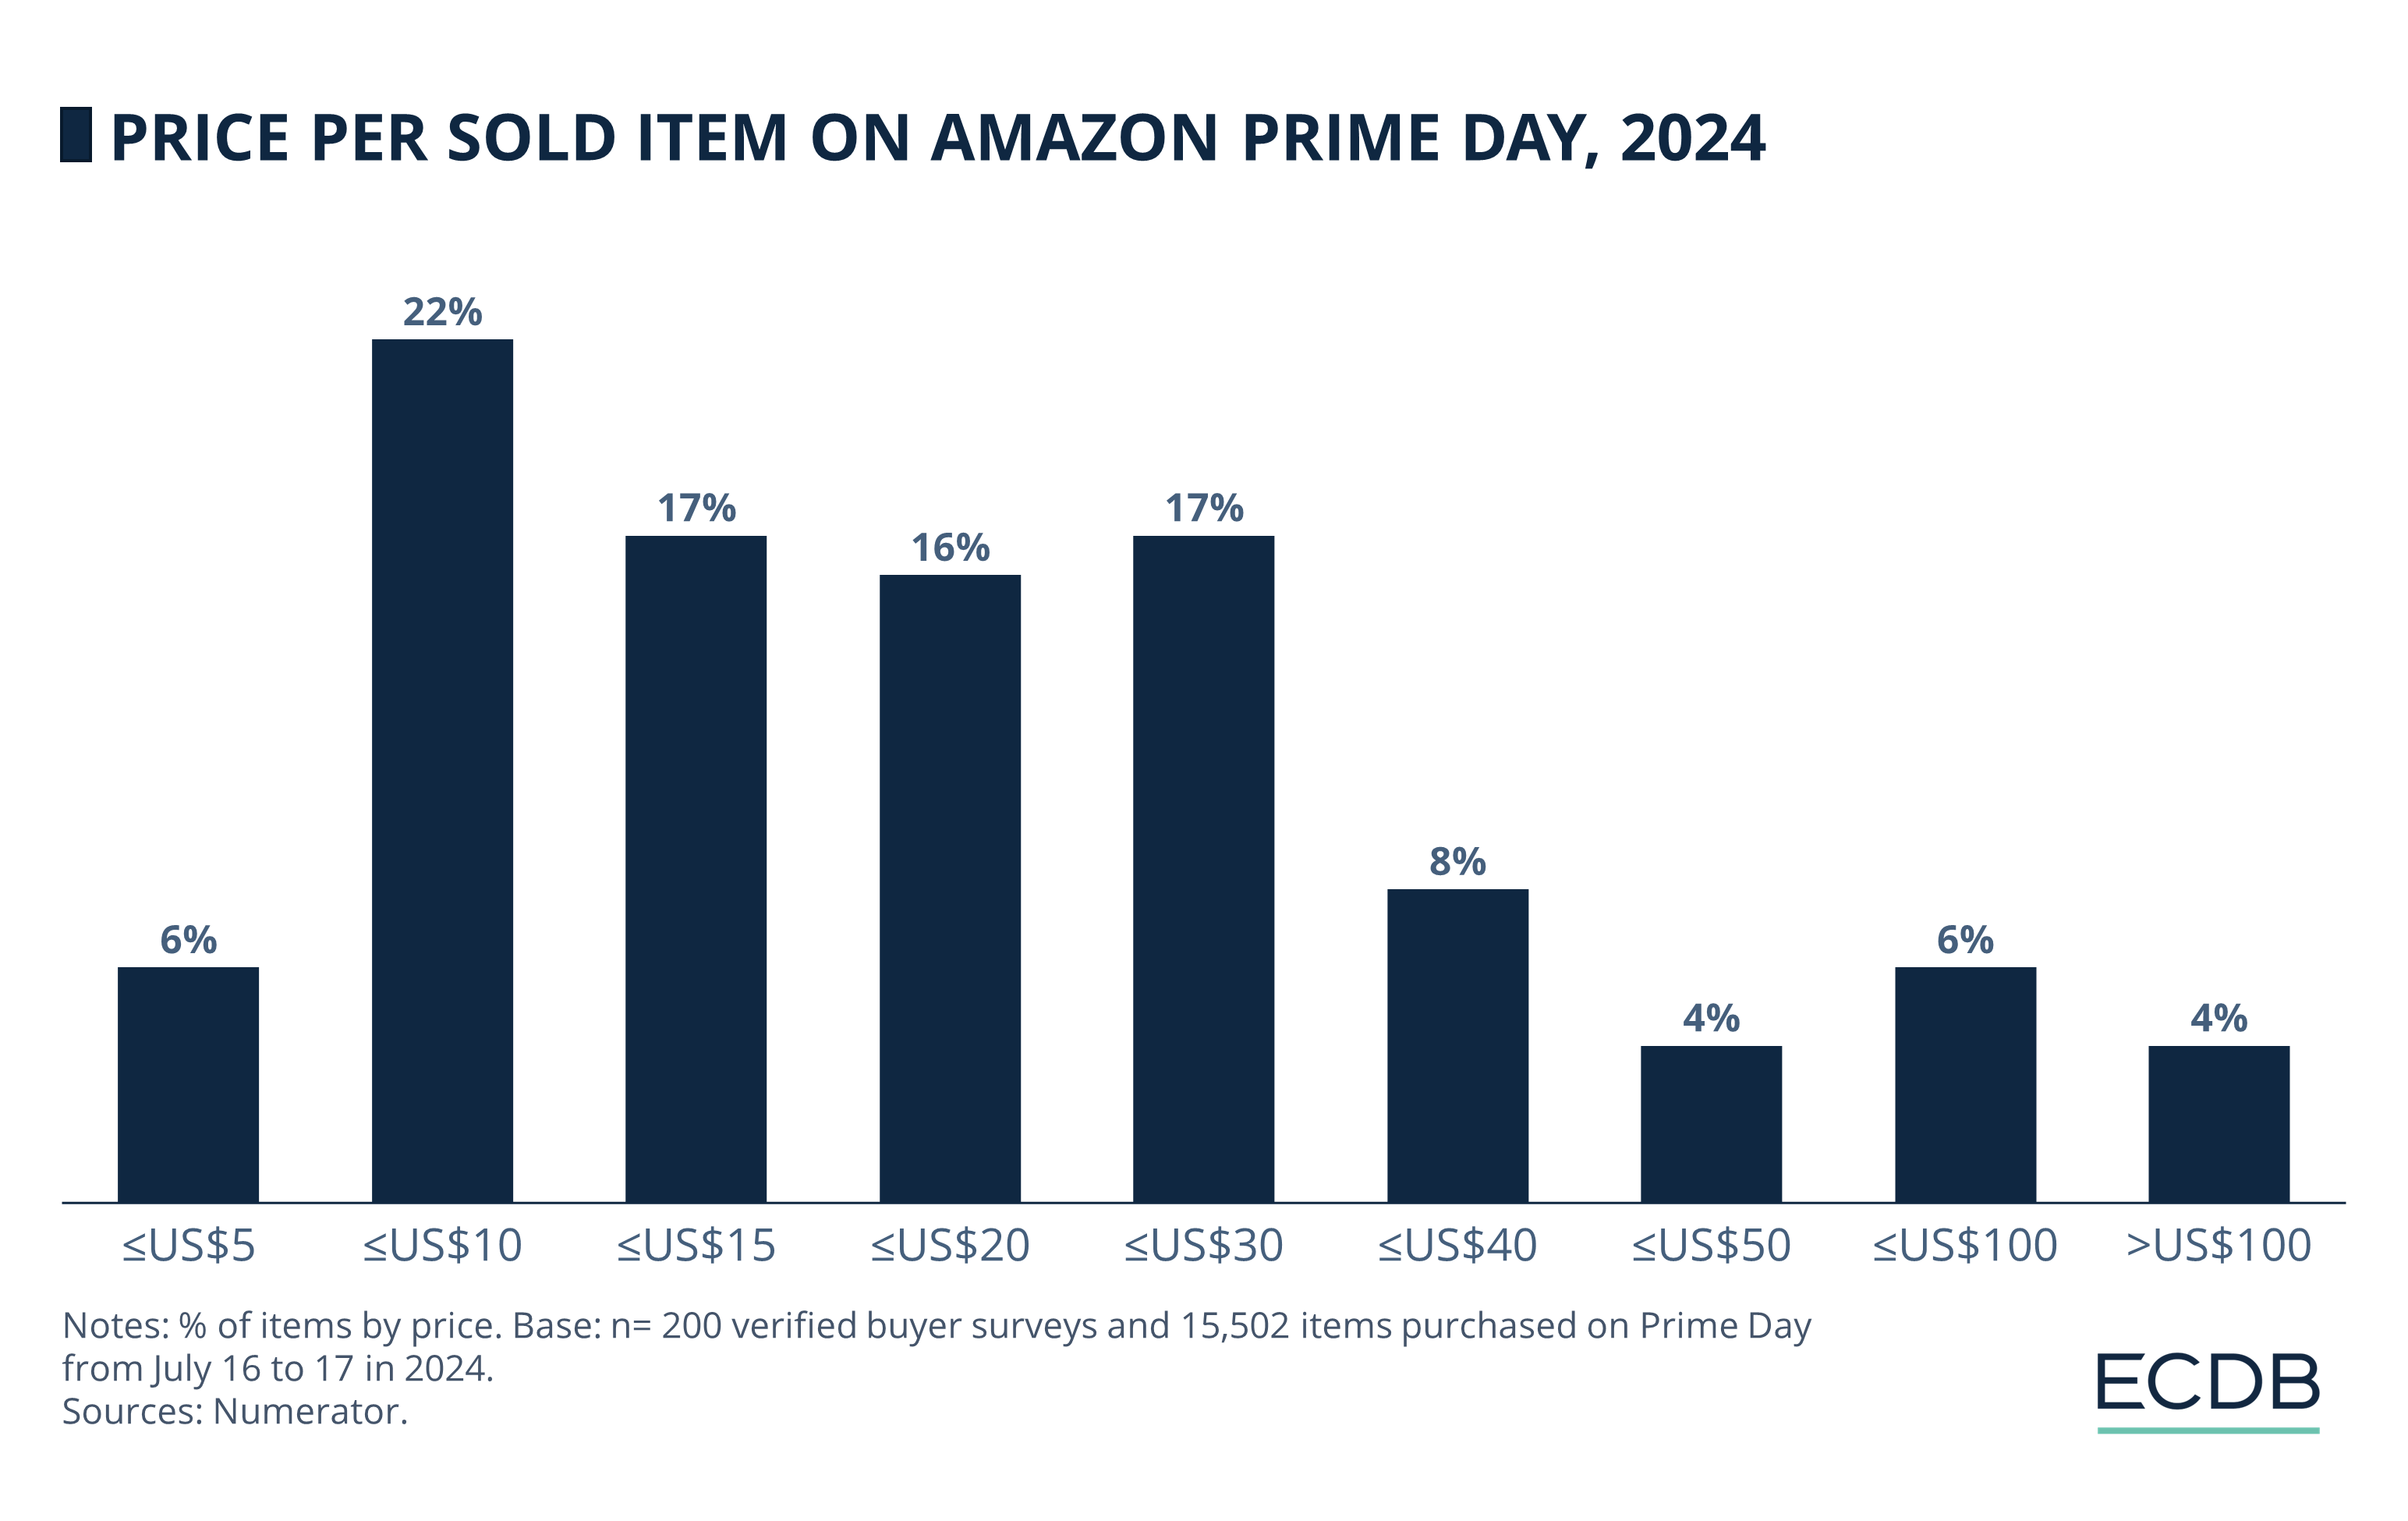
The vast majority of items, 78%, purchased were priced up to US$30.
Items costing more than US$40 were purchased much less often: The remaining 22% of items were bought at this price.
Apart from the order size, it is also interesting to know what consumers primarily purchased.
Prime Day 2024: Fashion Products Win
The 2024 ranking differs significantly from last year's in terms of the most popular product categories. Fashion products, or clothing and footwear, ranked first, just ahead of home goods (26%) and household essentials (25%).
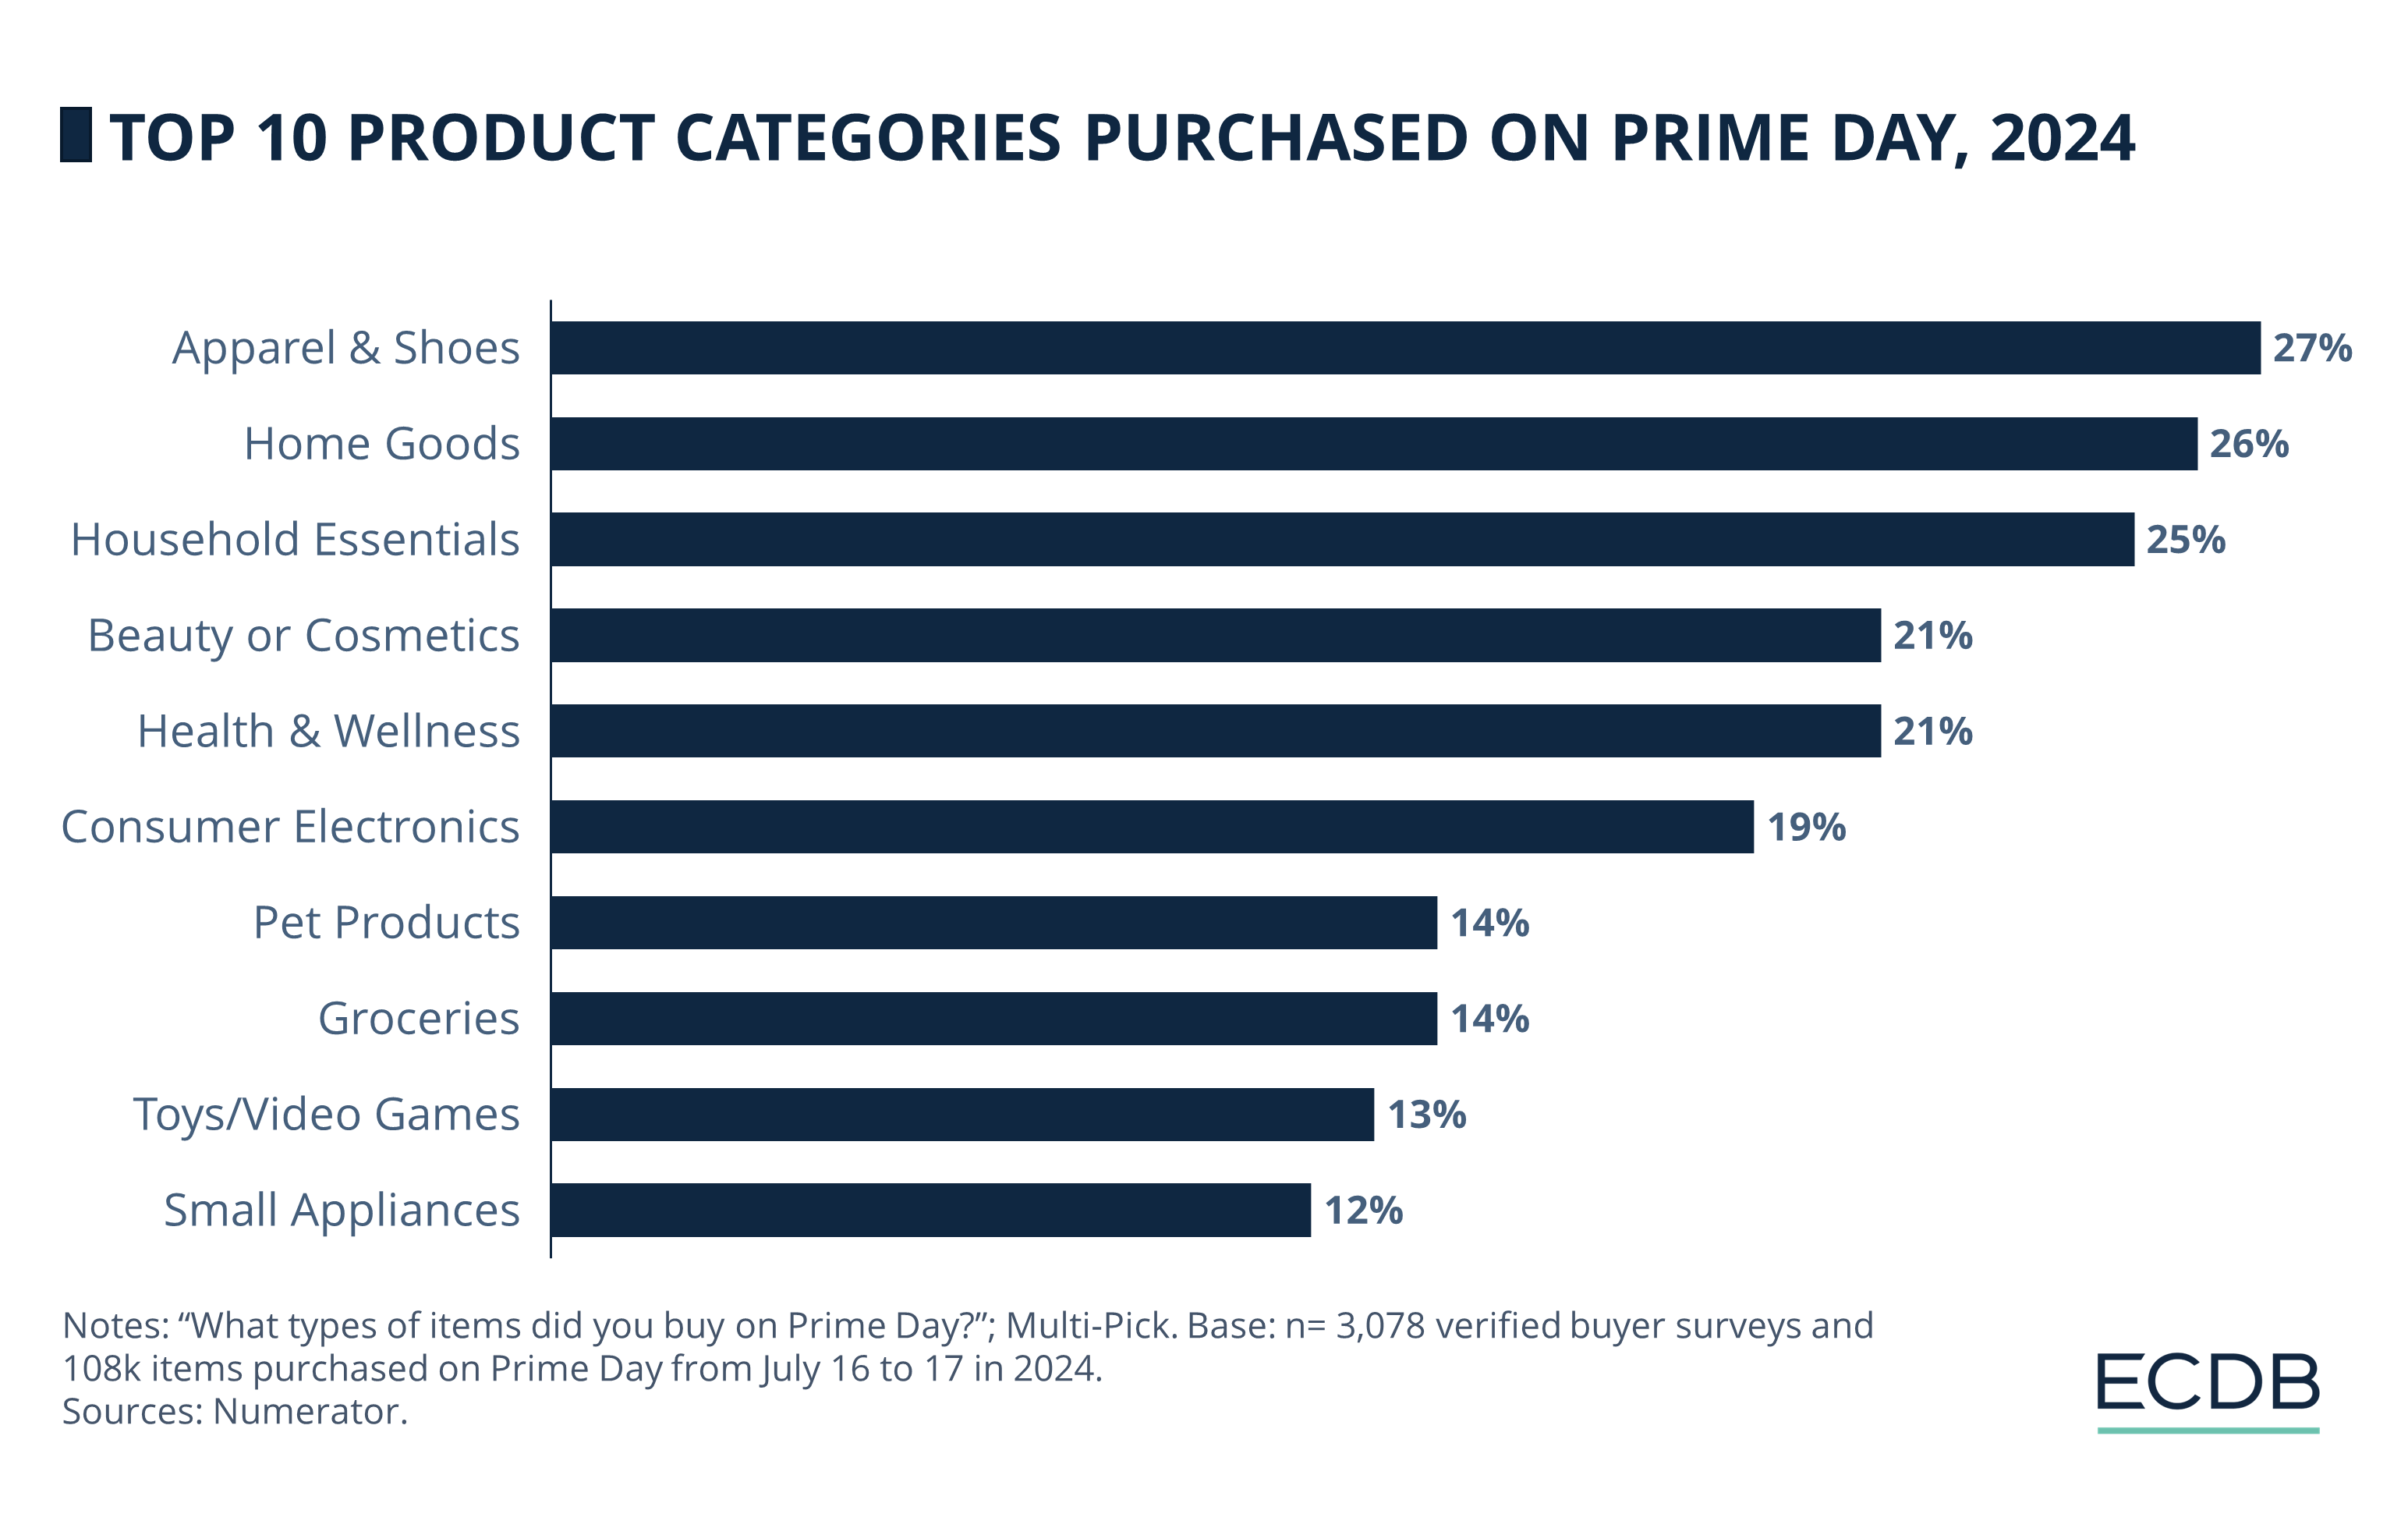
Ranked 4th through 6th were Beauty or Cosmetics and Health & Wellness, both at 21%. Consumer Electronics came in sixth with 19%.
The rest of the rankings are Pet Products and Groceries, which were both purchased by 14% of Prime shoppers. Toys/Video Games came in next to last at 13%, while Small Appliances ranked 10th with a share of 12%.
Amazon's impact on the industry is immense. As a result, other retailers tend to do what Amazon does.
Other Summer Sales: Target, Walmart & Best Buy Participate
As mentioned in the introduction, Amazon is a role model for companies in a variety of industries. Its market dominance is solidified by Amazon's customer-centric approach, which leads to sales increases every year. To compete, Amazon's competitors launch their own versions of Prime Day at the same time or slightly earlier.
The Prime Day alternatives from Amazon’s biggest competitors in the U.S. are:
Target Circle Week, taking place from July 7 to 13
Walmart Deals, from July 8 to 11
Best Buy Black Friday, occurring between July 15 and 17
What summer sales are Prime Day shoppers interested in?
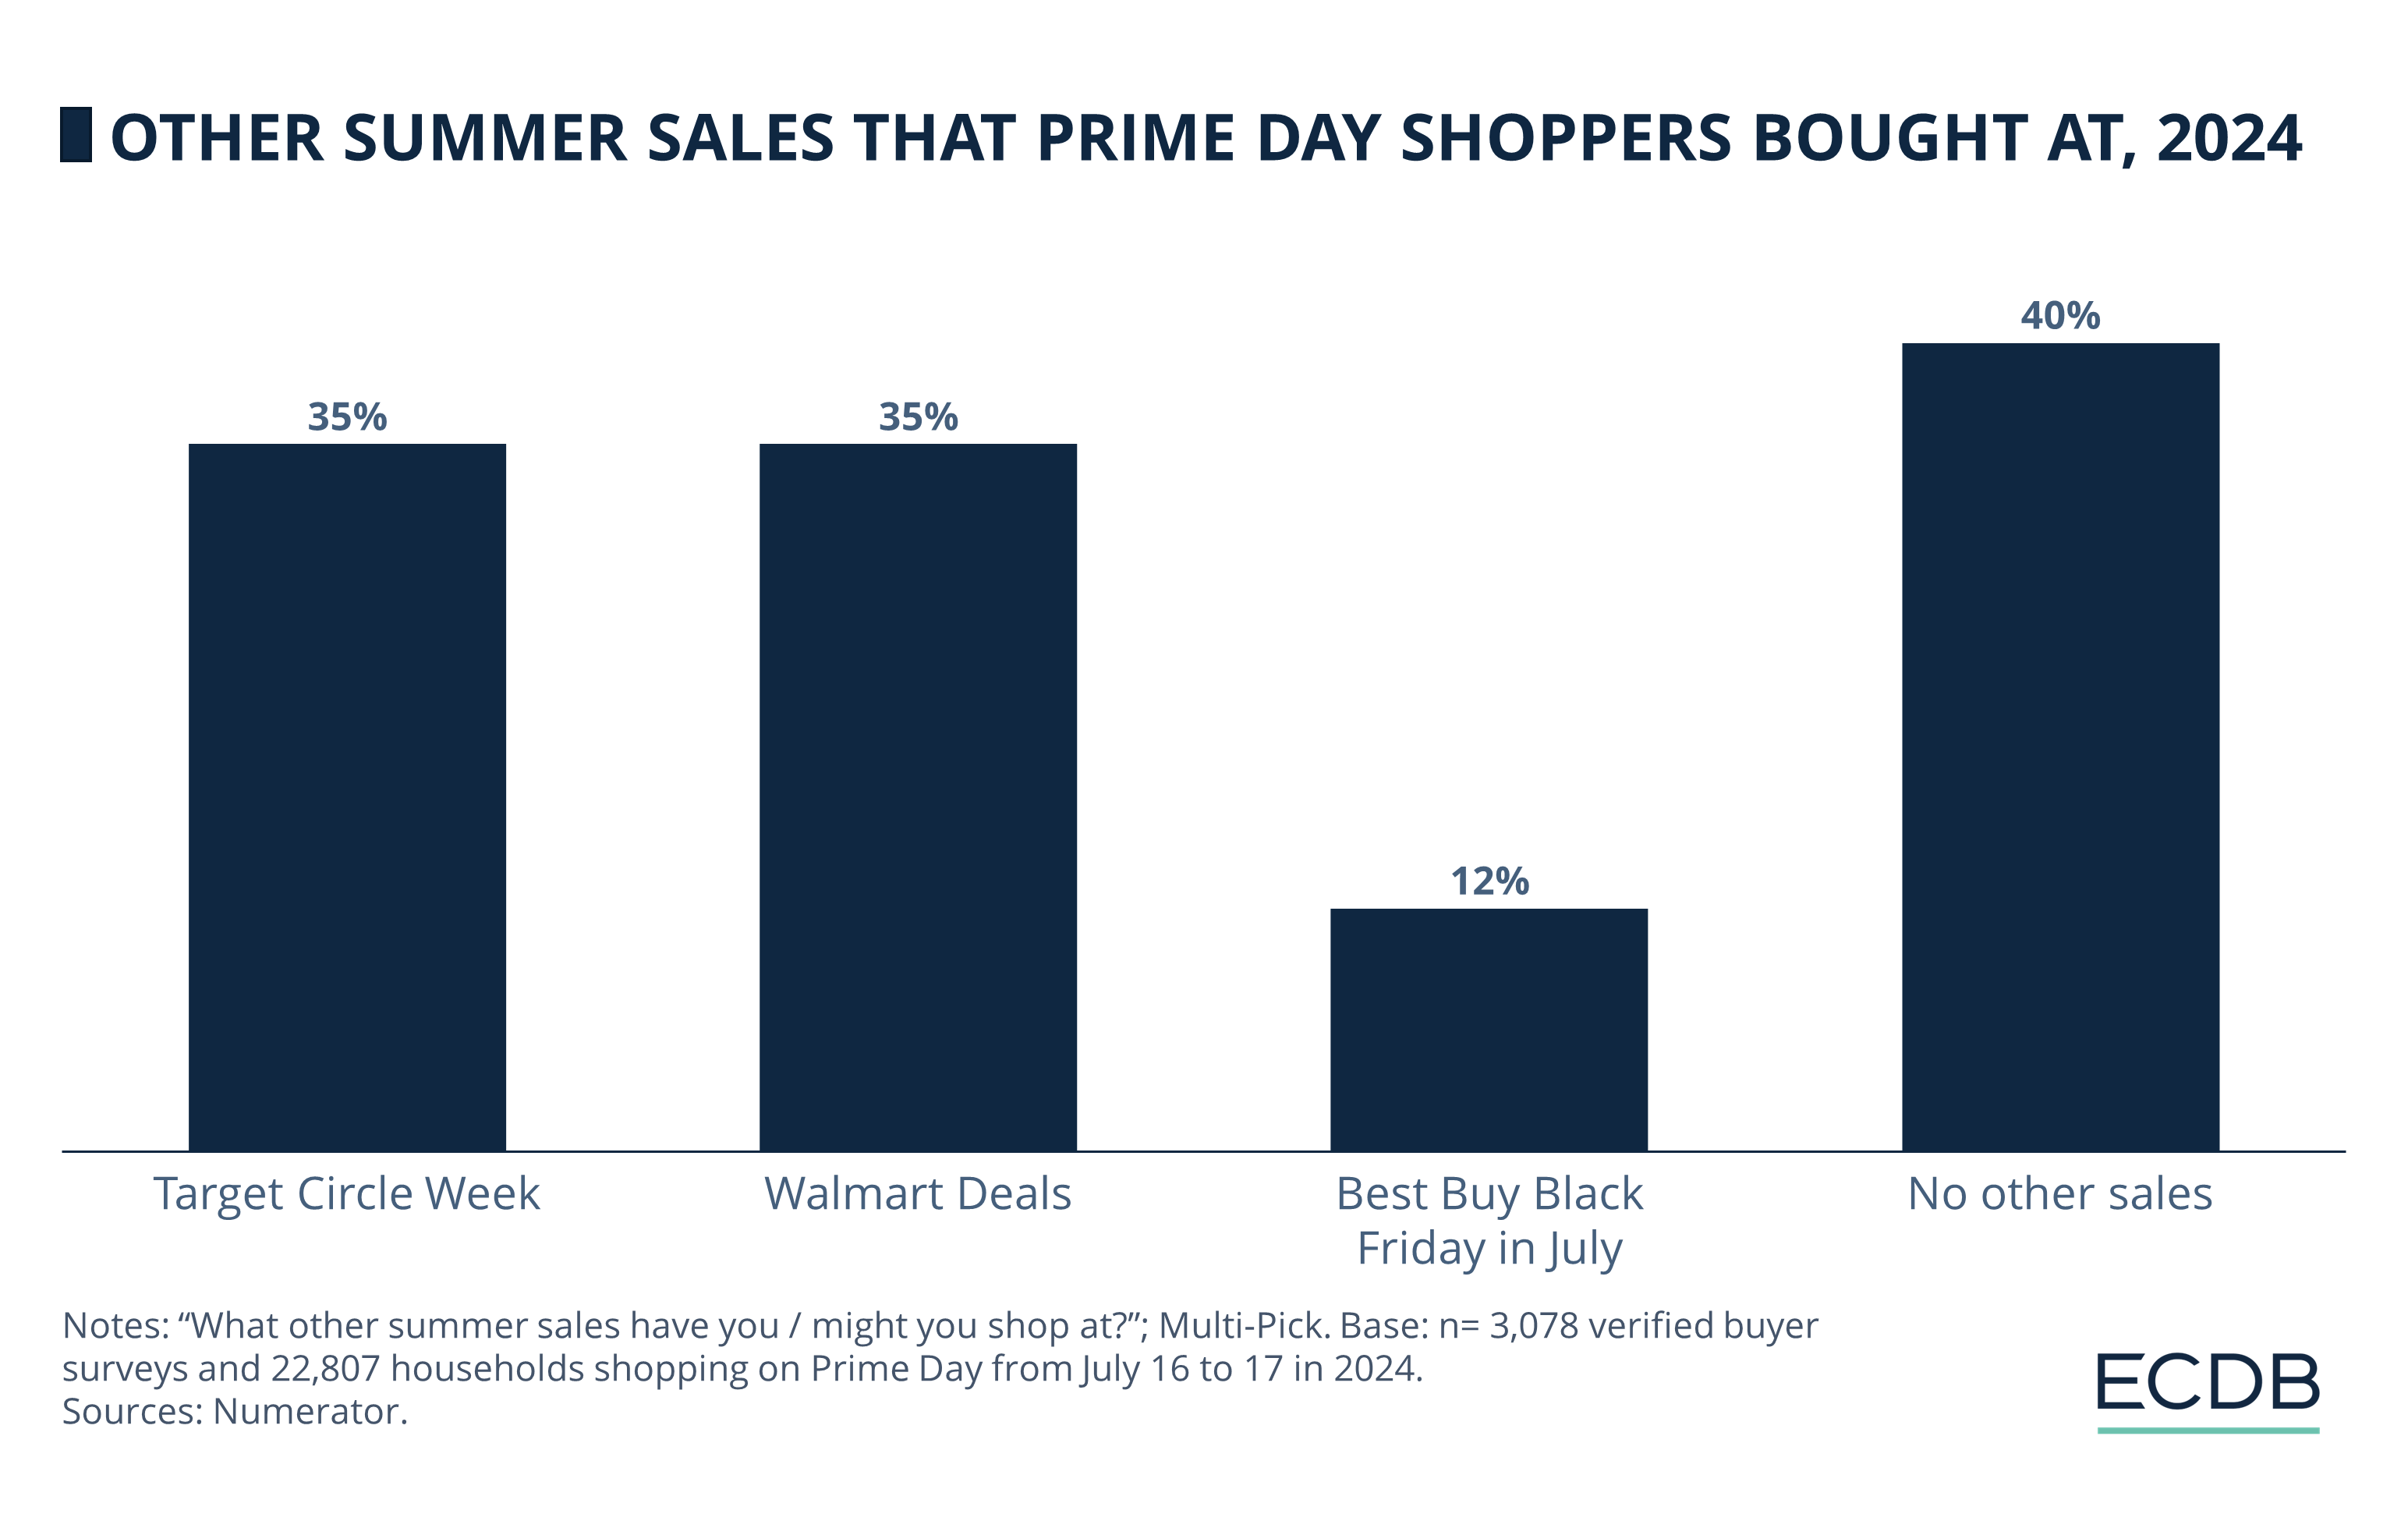
Target Circle Week and Walmart Deals tied for the highest share of Prime Day shopper participation, at 35% each.
Best Buy Black Friday in July is less relevant, mentioned by 12% of Prime Day shoppers.
Most likely, however, Prime Day shoppers did not participate in any other summer sales. 40% of users said that they did not buy anything there.
The problem with having a plethora of choices is that shoppers only have so much to spend on: and just because there are several summer sales occurring at the same time, they are not going to automatically participate in each one.
Temu Hosts Own Discount Event
Another Amazon competitor that Numerator did not include in the study also held its own summer sale in response to Prime Day: Temu Week.
Because Temu’s prices start from a lower base than any comparable platform in the West, including Amazon, Temu Week sold items at prices around $1 or less.
There are no specific figures on the number of sales made during this discount event, but it is expected that Temu will provide Amazon with competition that should not be underestimated. Not for nothing did Amazon recently announce plans for its own discount segment on its platform in response to the likes of Temu and Shein.
A significant negative aspect of Temu’s approach, however, is the inferior quality of products. Whether it pays for Amazon to stoop down to this level, remains to be seen.
The fact is that Prime Day to this day is still the number one discounting event for consumers in the U.S., and Amazon is still the number one eCommerce platform in the West.

Prime Day 2024: Closing Remarks
Consumer spending patterns for this year’s Prime Day were consistent with the previous year’s, and only minor variations compared to 2023 and 2022. For instance, there was a trend toward slightly higher average order sizes and household spending this year, which could signify a recovery from post-pandemic economic slowdowns and inflation.
Adobe forecast a total spending of US$14 billion this year on Prime Day in the U.S. alone, up from US$12.7 billion in 2023. Despite the growing popularity of low-cost platforms from Asia, it appears that Amazon still has the upper hand over competitors domestic and abroad.
Sources: AboutAmazon – Adobe: 1 2 – Digitalcommerce360: 1 2 – Nikkei – Numerator
Click here for
more relevant insights from
our partner Mastercard.
Related insights
Deep Dive
ByteDance Is Big on Personal Care, Powered by Content on Douyin and TikTok Shop
ByteDance Is Big on Personal Care, Powered by Content on Douyin and TikTok Shop
Deep Dive
Walmart Passes Apple as Amazon’s Lead in U.S. Online Store Ranking Diminishes
Walmart Passes Apple as Amazon’s Lead in U.S. Online Store Ranking Diminishes
Deep Dive
eCommerce in Canada: Top Stores, Market Development & Trends
eCommerce in Canada: Top Stores, Market Development & Trends
Deep Dive
Top Online Stores in Europe: Amazon Accounts for 40% of Top 20's Sales
Top Online Stores in Europe: Amazon Accounts for 40% of Top 20's Sales
Deep Dive
Top eCommerce Companies by Market Cap 2024
Top eCommerce Companies by Market Cap 2024
Back to main topics