eCommerce: Most Profitable Regions, Countries, and Industries
Top 250 eCommerce Companies: Global Trends, Revenue & Strategies
Where do the top 250 eCommerce companies operate? ECDB provides data on revenues by world region, country and industry. Can you guess where publicly traded eCommerce companies do best?
Article by Nadine Koutsou-Wehling | July 16, 2024Download
Coming soon
Share

Top eCommerce Companies: Key Insights
Regional Revenue Distribution: The Americas are leading regions in terms of where the top 250 eCommerce companies perform best. Asia follows in second place, while Europe and Oceania are further behind.
Country-Specific Relevance: The United States and China are where most of the top-performing 250 eCommerce companies are headquartered. The UK, Japan, and Germany are also significant, but not to the same extent as the first two countries.
Industry Breakdown: The Internet Retail sector, which is defined as companies that operate generalized eCommerce platforms, is where most eCommerce revenues are generated. Other important industries include Luxury Goods, Apparel, and Specialty Retail.
This insight focuses on the world’s top 250 publicly traded companies that derive at least a portion of their revenue from eCommerce activities. The criteria for their inclusion are based on market capitalization valuations, adopting a financial investment viewpoint rather than our usual focus on revenue generation.
The study covers companies with varying eCommerce involvement, such as Microsoft and Apple with multiple sales channels, as well as Amazon or Alibaba, which are pure online players. It presents total revenues across all sales channels and serves as the first in a series of ongoing, detailed examinations.
Which companies are the most valuable in eCommerce at the time? Find the dedicated top 10 list here.
Most Revenues in Americas
Looking at the total revenues of the top 250 publicly traded eCommerce companies, as defined above, this insight first takes a regional perspective.
Collectively, the 250 biggest companies account for revenues that are higher than the GDP of prosperous economies such as Germany or Japan. Revenues have grown consistently over the observed period at a CAGR (2019-2022) of 9%.
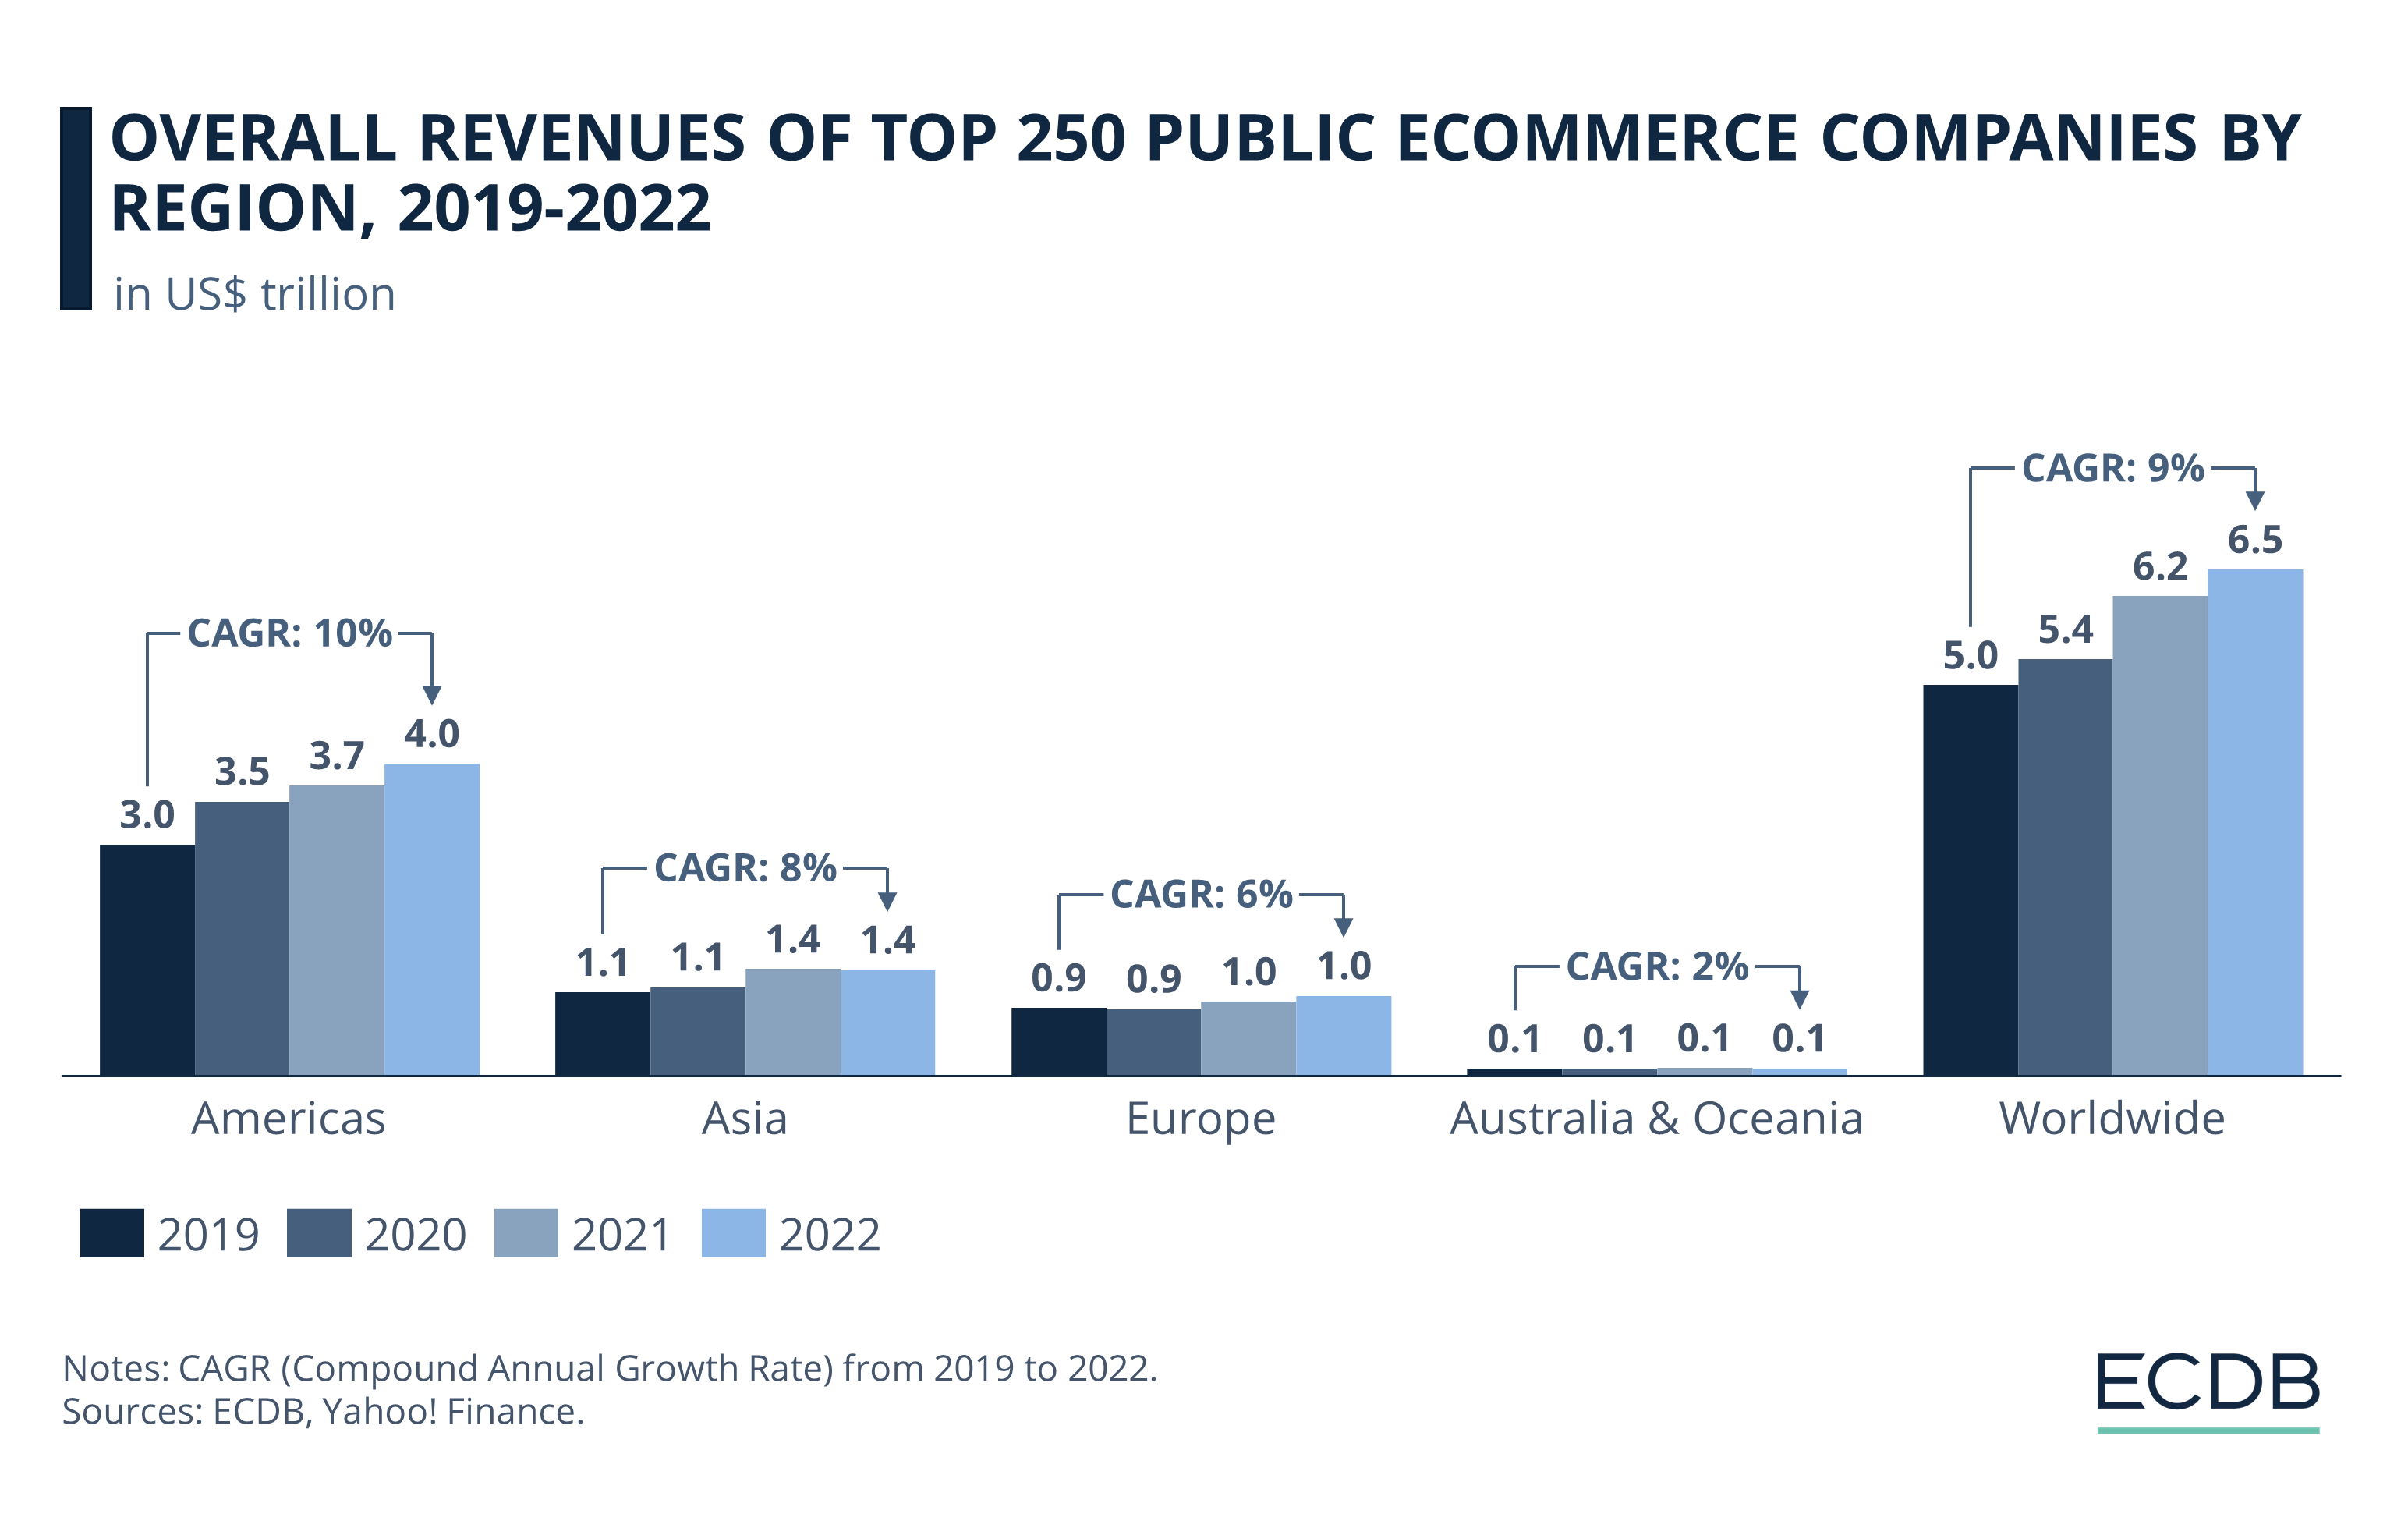
Of all the regions included in the subsequent breakdown, North America, together with Latin America, accounts for the largest share of the revenues generated by these top 250 companies.
More specifically, of the US$5 trillion generated in the pre-pandemic year of 2019, about 59.2% came from the Americas, and their annual growth rate between 2019 and 2022 outpaced global development by one percentage point.
Despite economic barriers during the pandemic and resulting inflationary pressures, as well as supply chain disruptions and the war in Ukraine, the top 250 public companies saw steady growth.
Asia Accounts for More Than One-Fifth of Global Sales
Other regions showed less pronounced development. Of these, Asia had the next highest revenue for the top 250 companies, but its figures are still well below American values.
Despite this, the top companies still generated annual revenues of more than US$1 trillion between 2019 and 2022 in Asia, with a slight decline from 2021 to 2022, but an overall CAGR of 8%. As a share of global numbers, Asia contributed 20.9% in 2022.
eCommerce in Europe and Oceania
Europe approaches Asian figures in both absolute and CAGR terms (2019-2022). European revenues surpassed US$1 trillion for the first time in 2022.
Australia & Oceania lags far behind with figures of around US$100 billion in 2022 and a low annual growth rate of 2%. As the smallest region in this sample, its deficit reflects this fact.
But size is not the whole story. Africa, for example, has not been included in this sample. This is because the world’s top 250 companies generate miniature figures in Africa, even though it is a large continent.
While a regional perspective provides a good overview over global revenue distribution, it still lacks specificity. In which countries are most of the top-performing eCommerce companies headquartered?
U.S. Has Highest Revenues, While China Grows Steepest
Country affiliation is determined by the presence of corporate headquarters. Together, the five countries below account for 65% of the 250 companies included in the analysis.
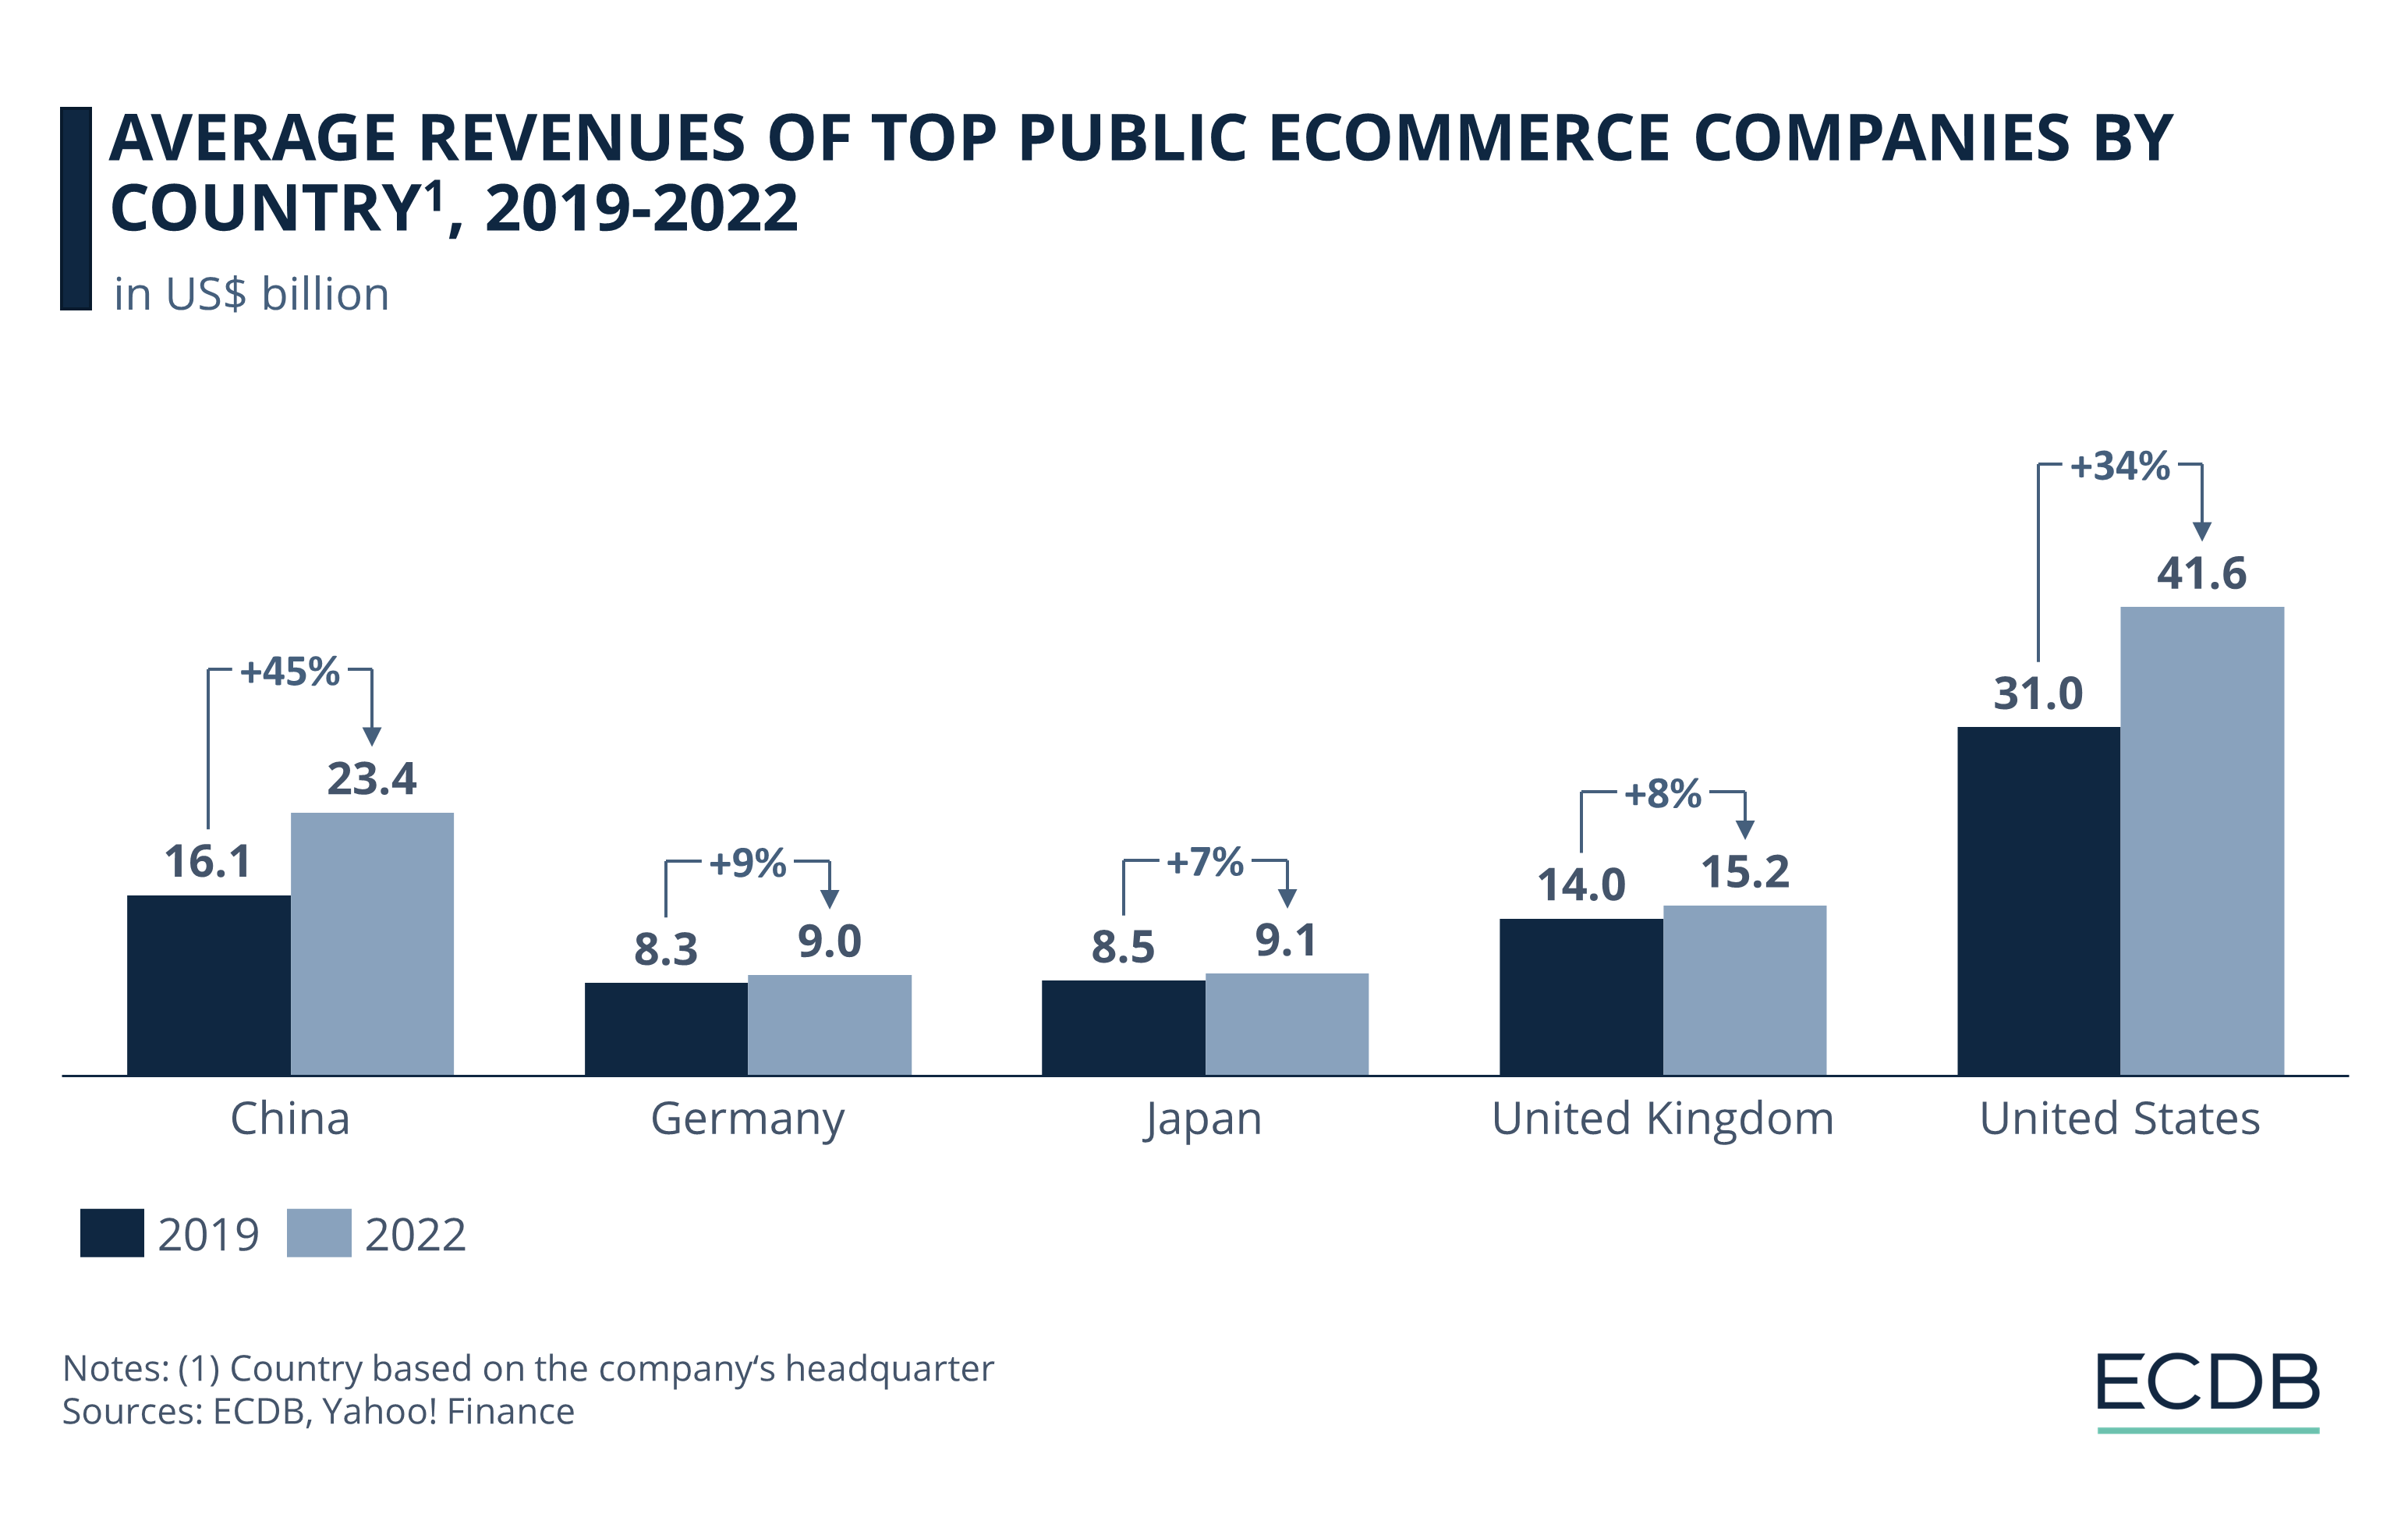
The United States and China are significantly ahead of the other three nations, and the growth over the observed period is most pronounced in both countries.
While the U.S. already started at a high level in 2019 with revenues of US$31 billion, an overall growth rate of 34% resulted in US$41.6 billion by 2022.
Despite the pandemic, the largest companies were able to maintain steady revenue increases over the years.
Stay Competitive: Our constantly updated rankings provide you with the latest insights to improve your business strategy. Discover which stores and companies are at the top of the eCommerce world and which categories are driving the highest sales. Dive into our rankings for companies, stores, and marketplaces. Stay a step ahead in the market with ECDB.
While China Follows U.S. Lead, Other Countries Lag Far Behind
China’s story is similar, though not identical.
With a lower starting point of US$16.1 billion in 2019, revenues peaked momentarily in 2021 at US$24.1 billion, but declined again in the following year to US$23.4 billion.
However, with a growth of 45% from 2019 to 2022, China’s top companies reported steeper increases than U.S. companies, at a difference of more than 10 percentage points.

Chinese and U.S. growth rates are particularly noteworthy in relation to the increases of the remaining three countries, which did not reach double digits during the same period.
Of these, the United Kingdom leads with revenues of US$15.2 billion in 2022 and a growth rate of 8%.
It is followed by Japan (2022: US$9.1 billion and 8% growth) and Germany (2022: US$9 billion and 9% growth).
Revenue Statistics: Many Factors Play a Role
Among these five markets, the pandemic appears to have hit Germany and the UK the hardest, as evidenced by slight revenue declines of up to 0.3 percentage points in 2020.
At the same time, the post-pandemic recovery has been slower in these countries, while Japan even experienced a decline in 2022. Nonetheless, it is important to consider additional factors like Germany’s dependence on Russian gas and high inflationary pressures. Inflation has also increased the cost of energy and living in the UK, with slowing investment.
A mix of these factors affected the earnings performance of the highest-rated companies in the top 5 markets. This is in stark contrast to the two best performing countries, the U.S. and China.
In addition to a geographical analysis, there is also an industry perspective to consider.
Internet Retail Companies: Growth of 82% From 2019 to 2022
Below are the industries with highest eCommerce revenues from 2019 to 2022:
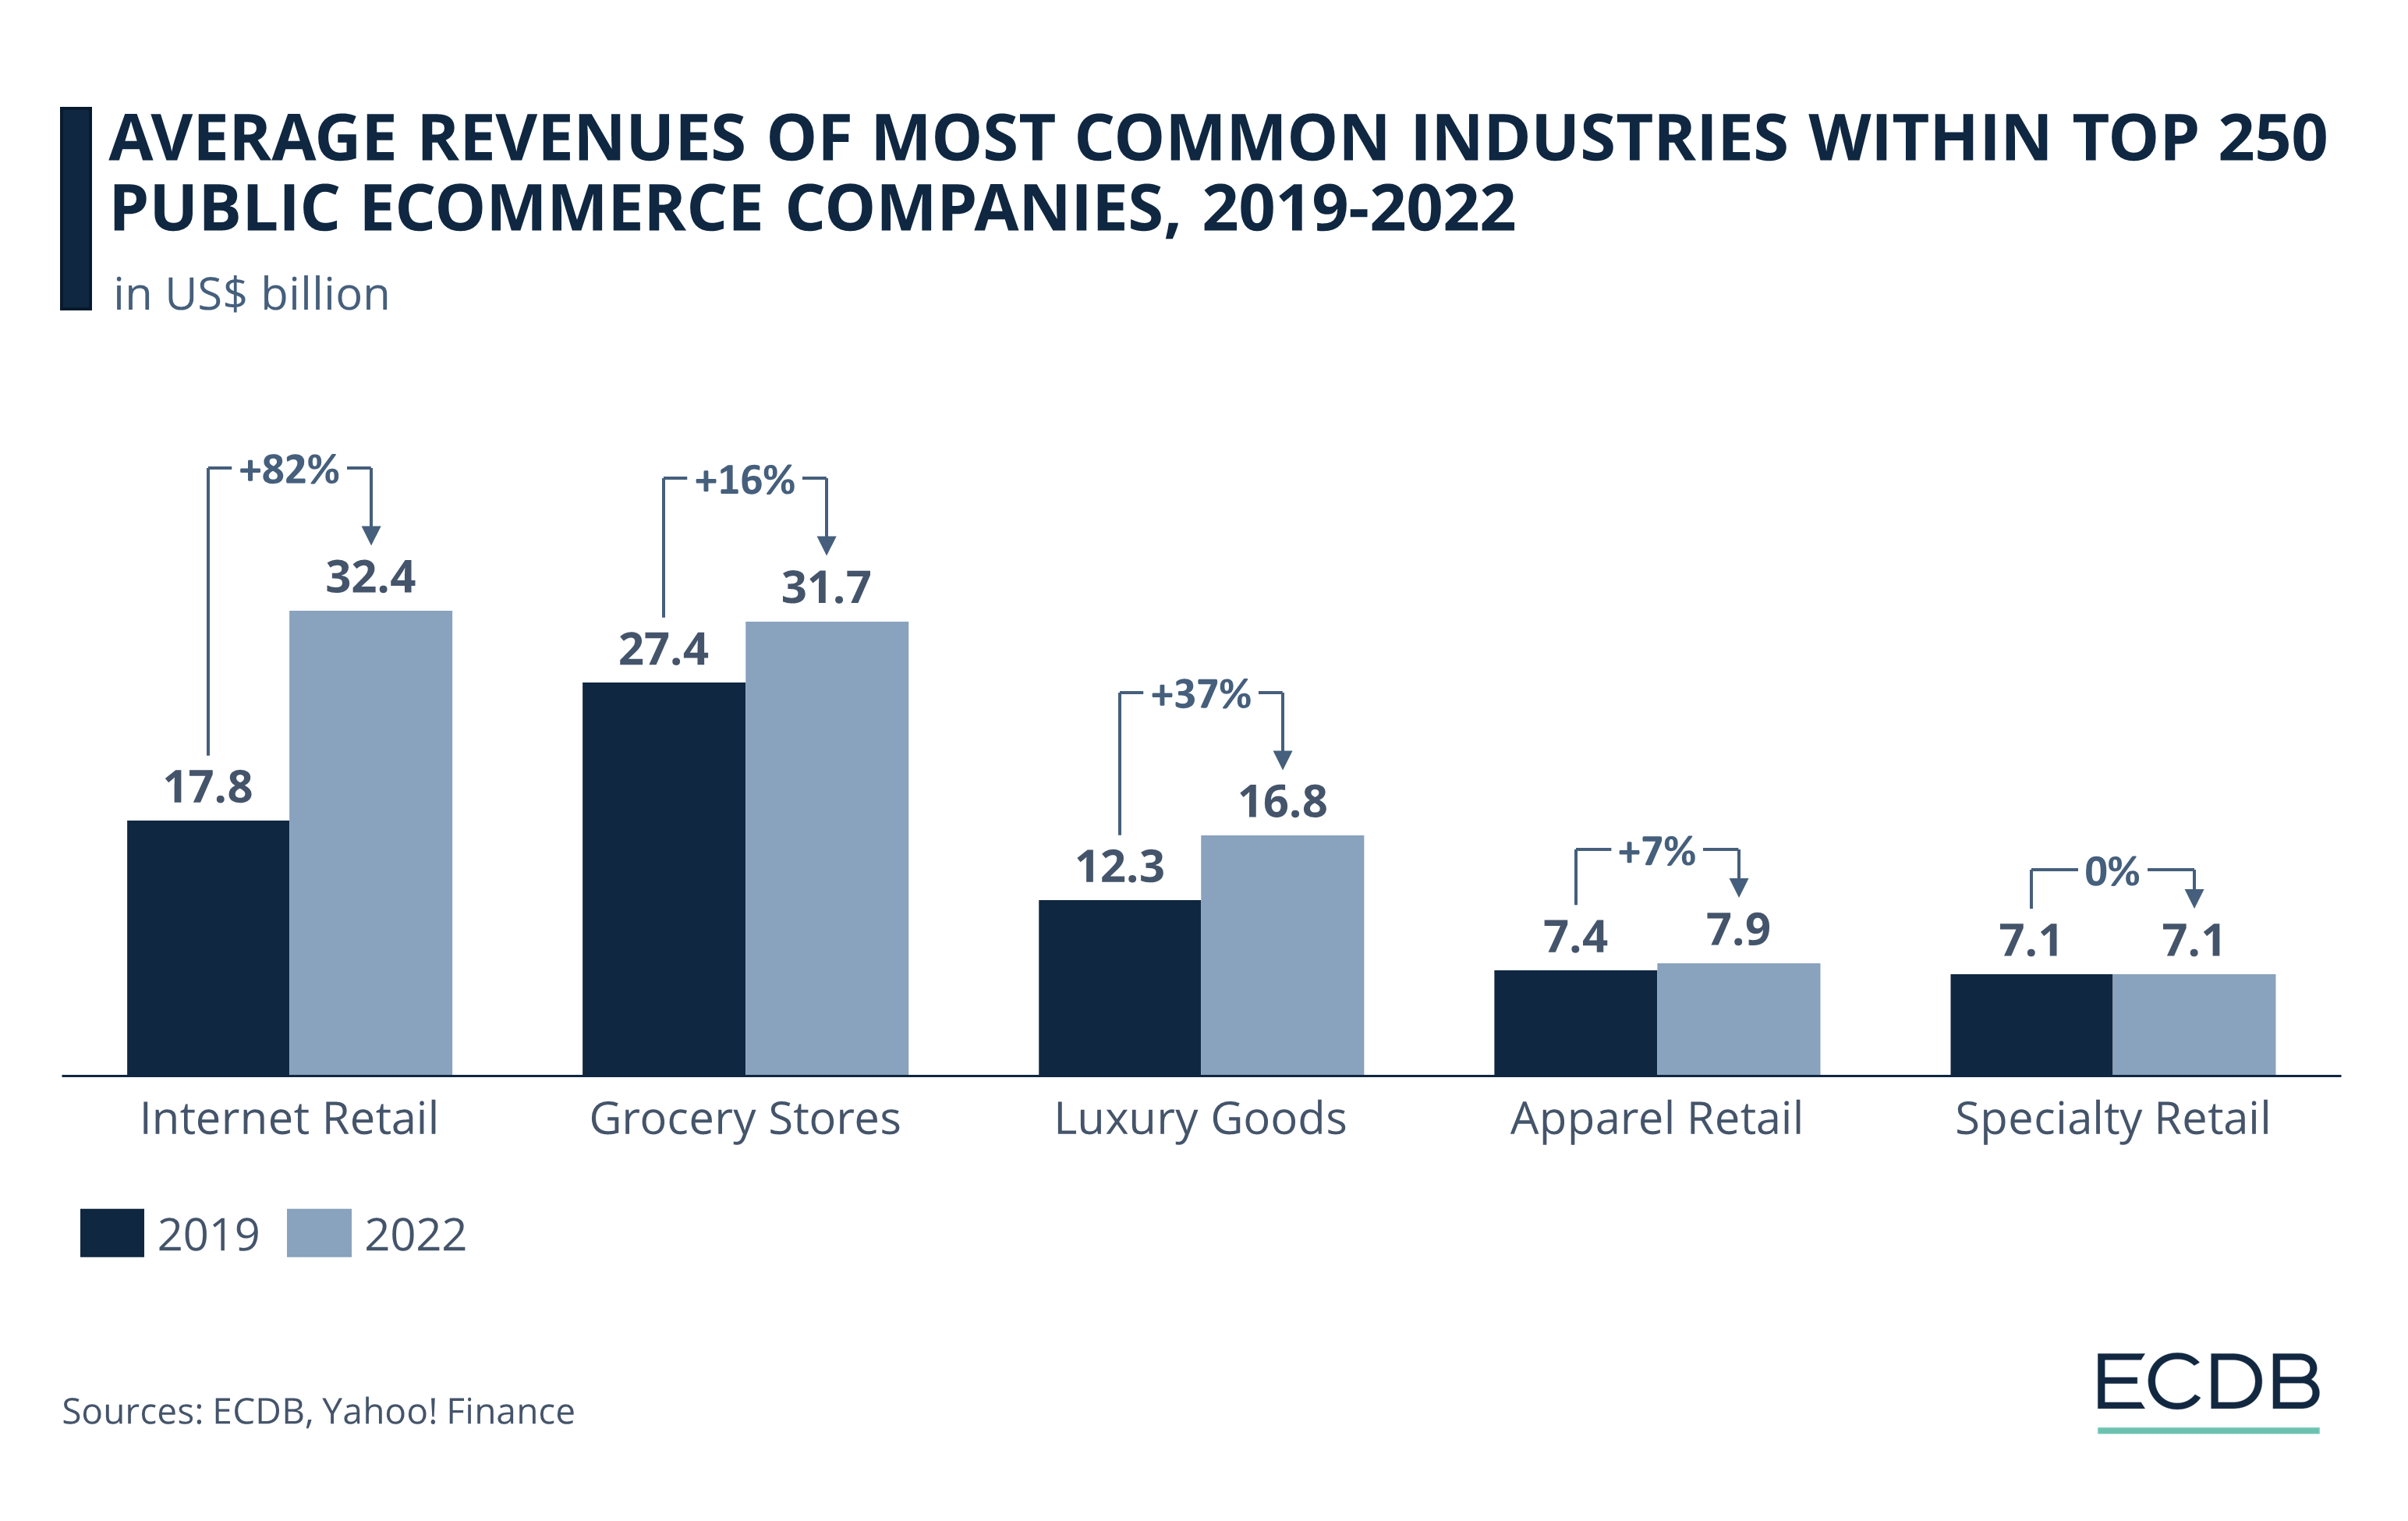
Internet Retail includes companies that operate an eCommerce platform or marketplace with a generalist approach. It has grown the most during the pandemic years, increasing by 82% from 2019 to 2022.
Revenues of US$17.8 billion in 2019 reached US$30.5 billion in 2021. They then increased to US$32.4 billion in 2022.
Grocery Stores to Maintain Steady Sales
Grocery Stores, on the other hand, set out from a high position with revenues of US$27.4 billion in 2019 and grew at a rate of 16% until 2022.
As our analysis includes both offline and online sales of the top companies in their respective sectors, eCommerce can be seen as a supplementary income for grocery stores over this period. Shoppers are always in need of groceries, which is why the continuously positive performance of grocery stores is to be expected.
Luxury Goods Grew at a High Rate
Among the remaining three categories observed, Luxury Goods stand out with a high increase of 37% between 2019 and 2022.
Despite a slight dip at the beginning of the pandemic in 2020, the sector rebounded quickly, with the top companies reaching US$16.8 billion in 2022.
For more information on the online luxury market, see the ECDB Luxury Report. Luxury goods are considered particularly resilient due to the continued affluence of consumers, even in challenging economic times.
Otherwise, Apparel and Specialty Retail had no chance to compete with the other categories in the study. Specialty Retail refers to stores that focus on a specific product category, as opposed to the generalist approach where a variety of product categories are the focus of sales.
While fashion still managed to generate positive growth overall at a rate of 7%, Specialty Retail grew intermittently but ended up at the same level in 2022 as it started out in 2019. Several influences likely play a role, including that generalist players are taking a slice of the specialist pie.

Top 250 eCommerce Companies: Closing Remarks
The digital shift and eCommerce growth has benefited many industries. An examination of the top 250 publicly traded companies shows that the Americas account for the largest share of eCommerce revenues. This is due to the dominance of the United States as the headquarters of leading eCommerce companies.
But Asia, particularly China, is closing the gap in the race to the most profitable region for eCommerce. Growing consumer affluence and the emergence of innovative companies with appealing eCommerce business approaches are expected to accelerate the growth of Asian eCommerce companies.
Click here for
more relevant insights from
our partner Mastercard.
Related insights
Deep Dive
eCommerce Payments in China: Alipay, WeChat & Top Payment Methods
eCommerce Payments in China: Alipay, WeChat & Top Payment Methods
Deep Dive
Top eCommerce Companies by Market Cap 2024
Top eCommerce Companies by Market Cap 2024
Deep Dive
Tinaba Partners with Alipay+ to Launch European Super App
Tinaba Partners with Alipay+ to Launch European Super App
Deep Dive
Alibaba Leverages AI and Promotions to Boost Singles' Day Sales
Alibaba Leverages AI and Promotions to Boost Singles' Day Sales
Deep Dive
Alibaba Competitors: Which Companies Are Alibaba’s Biggest eCommerce Rivals?
Alibaba Competitors: Which Companies Are Alibaba’s Biggest eCommerce Rivals?
Back to main topics