APPLE REVENUE
Inside Apple Revenue: Latest Sales Figures and Key Insights
Despite its status as a premium tech giant, Apple’s revenues fell in 2023. Its cornerstone product, iPhone, also had faltering sales. Find out how Apple’s revenue, segment and category performance stacks up, and what this could mean for Apple’s future.
Article by Nashra Fatima | October 14, 2024Download
Coming soon
Share

Apple’s Revenue Performance: Key Insights
eCommerce and Net Sales: After three years of consistent growth, Apple Inc.’s net sales declined by 3% in 2023, reaching US$383 billion. Its eCommerce sales (US$47.2 billion) decreased by a larger 17% in the same year, though moderate recovery is expected in 2024.
Top Markets: The United States contributes nearly 55% to Apple’s net revenue. Other markets are much smaller in comparison and include Japan (6.4%), China (6.3%), and the UK (4.9%).
Apple’s Revenue Streams: Nearly 78% of Apple’s net sales came from its products in 2023, with iPhone responsible for over 50% of products’ total contribution. Apple’s services segment is smaller but has seen promising growth in recent years.
Which company is a global leader in the smartphones market, and was crowned the most valuable brand in both 2022 and 2023? The correct answer is Apple, Inc.
Apple’s Q3 2024 earnings report a 5% increase from the same period last year. It appears the strong brand reputation is backed up by sales figures. Despite this recent gain, Apple’s performance in the previous year was less than stellar. 2023 was its year of declining growth.
Revenue and Net Sales: Definition
Revenue represents the total income a company earns primarily through the sale of goods, products, or services. Net sales are the final revenue a company earns after various deductions like returns, allowances, and sales discounts.
In this article, we also discuss Apple’s eCommerce performance. At ECDB, under eCommerce activity revenue, we include all gross first-party sales and third-party GMV generated on all online platforms operated by a company. In Apple’s case, its eCommerce sales come from its online store.
Apple Revenues: Company Net Sales Decrease Year-on-Year in 2023
Apple, Inc. showed consistently strong performance from 2019 to 2022. But the changing macroeconomic climate led to a decline in 2023. Here’s how Apple’s net sales developed between 2021 and 2023:
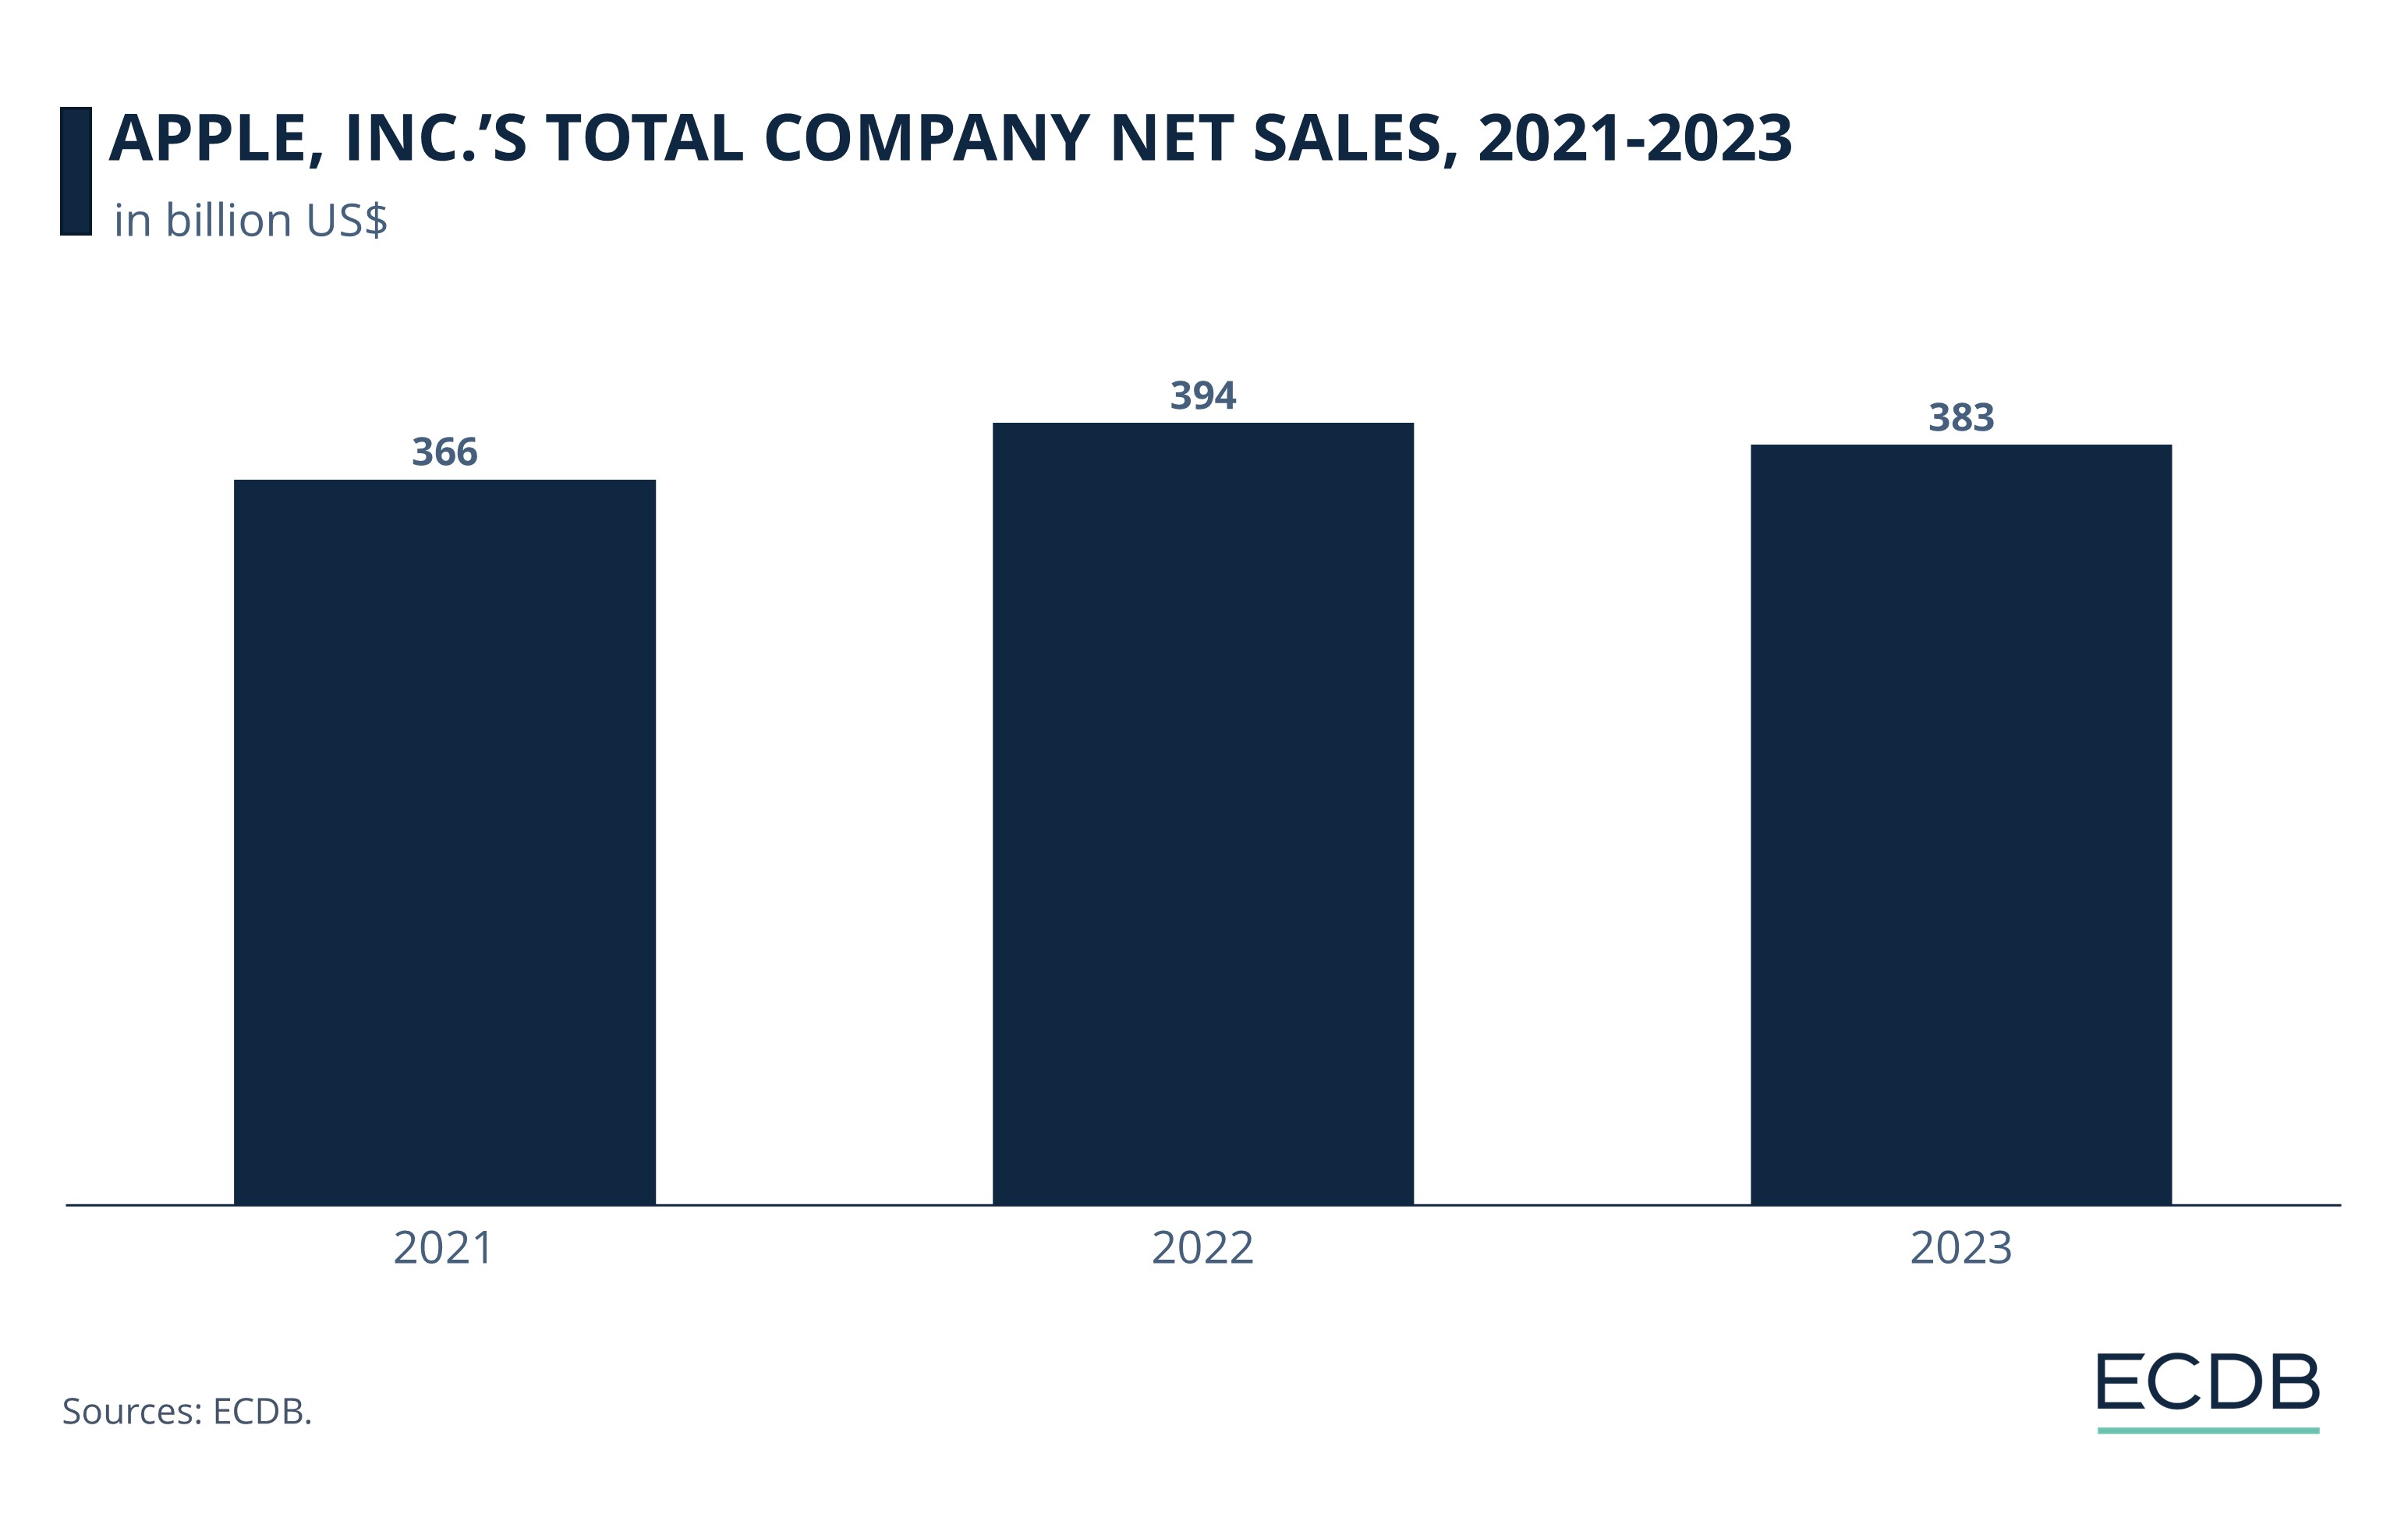
Apple’s total net sales grew by a remarkable 33% in 2021, reaching US$366 billion. All its product categories saw notable growth, with the biggest winners being iPhones (39%) and iPads (34%). Meanwhile, Apple’s Services also grew rapidly, at 27%.
The market began to normalize in the next year. Apple’s revenue still increased but at a slower pace. Its net sales reached US$394 billion in 2022.
In 2023, Apple’s net sales dropped to US$383 billion. Inflation and fears of recession, particularly in its largest market of the U.S., likely dampened consumer spending on Apple products, which are high-ticket.
From an offline versus online perspective, we see that after years of solid growth, Apple’s eCommerce channels saw a loss in 2023.
Apple eCommerce Revenue: Online Sales Decline in 2023
After a four-year period of consistent increase, Apple’s eCommerce sales decreased in 2023. Our data shows how the company’s online sales have developed:
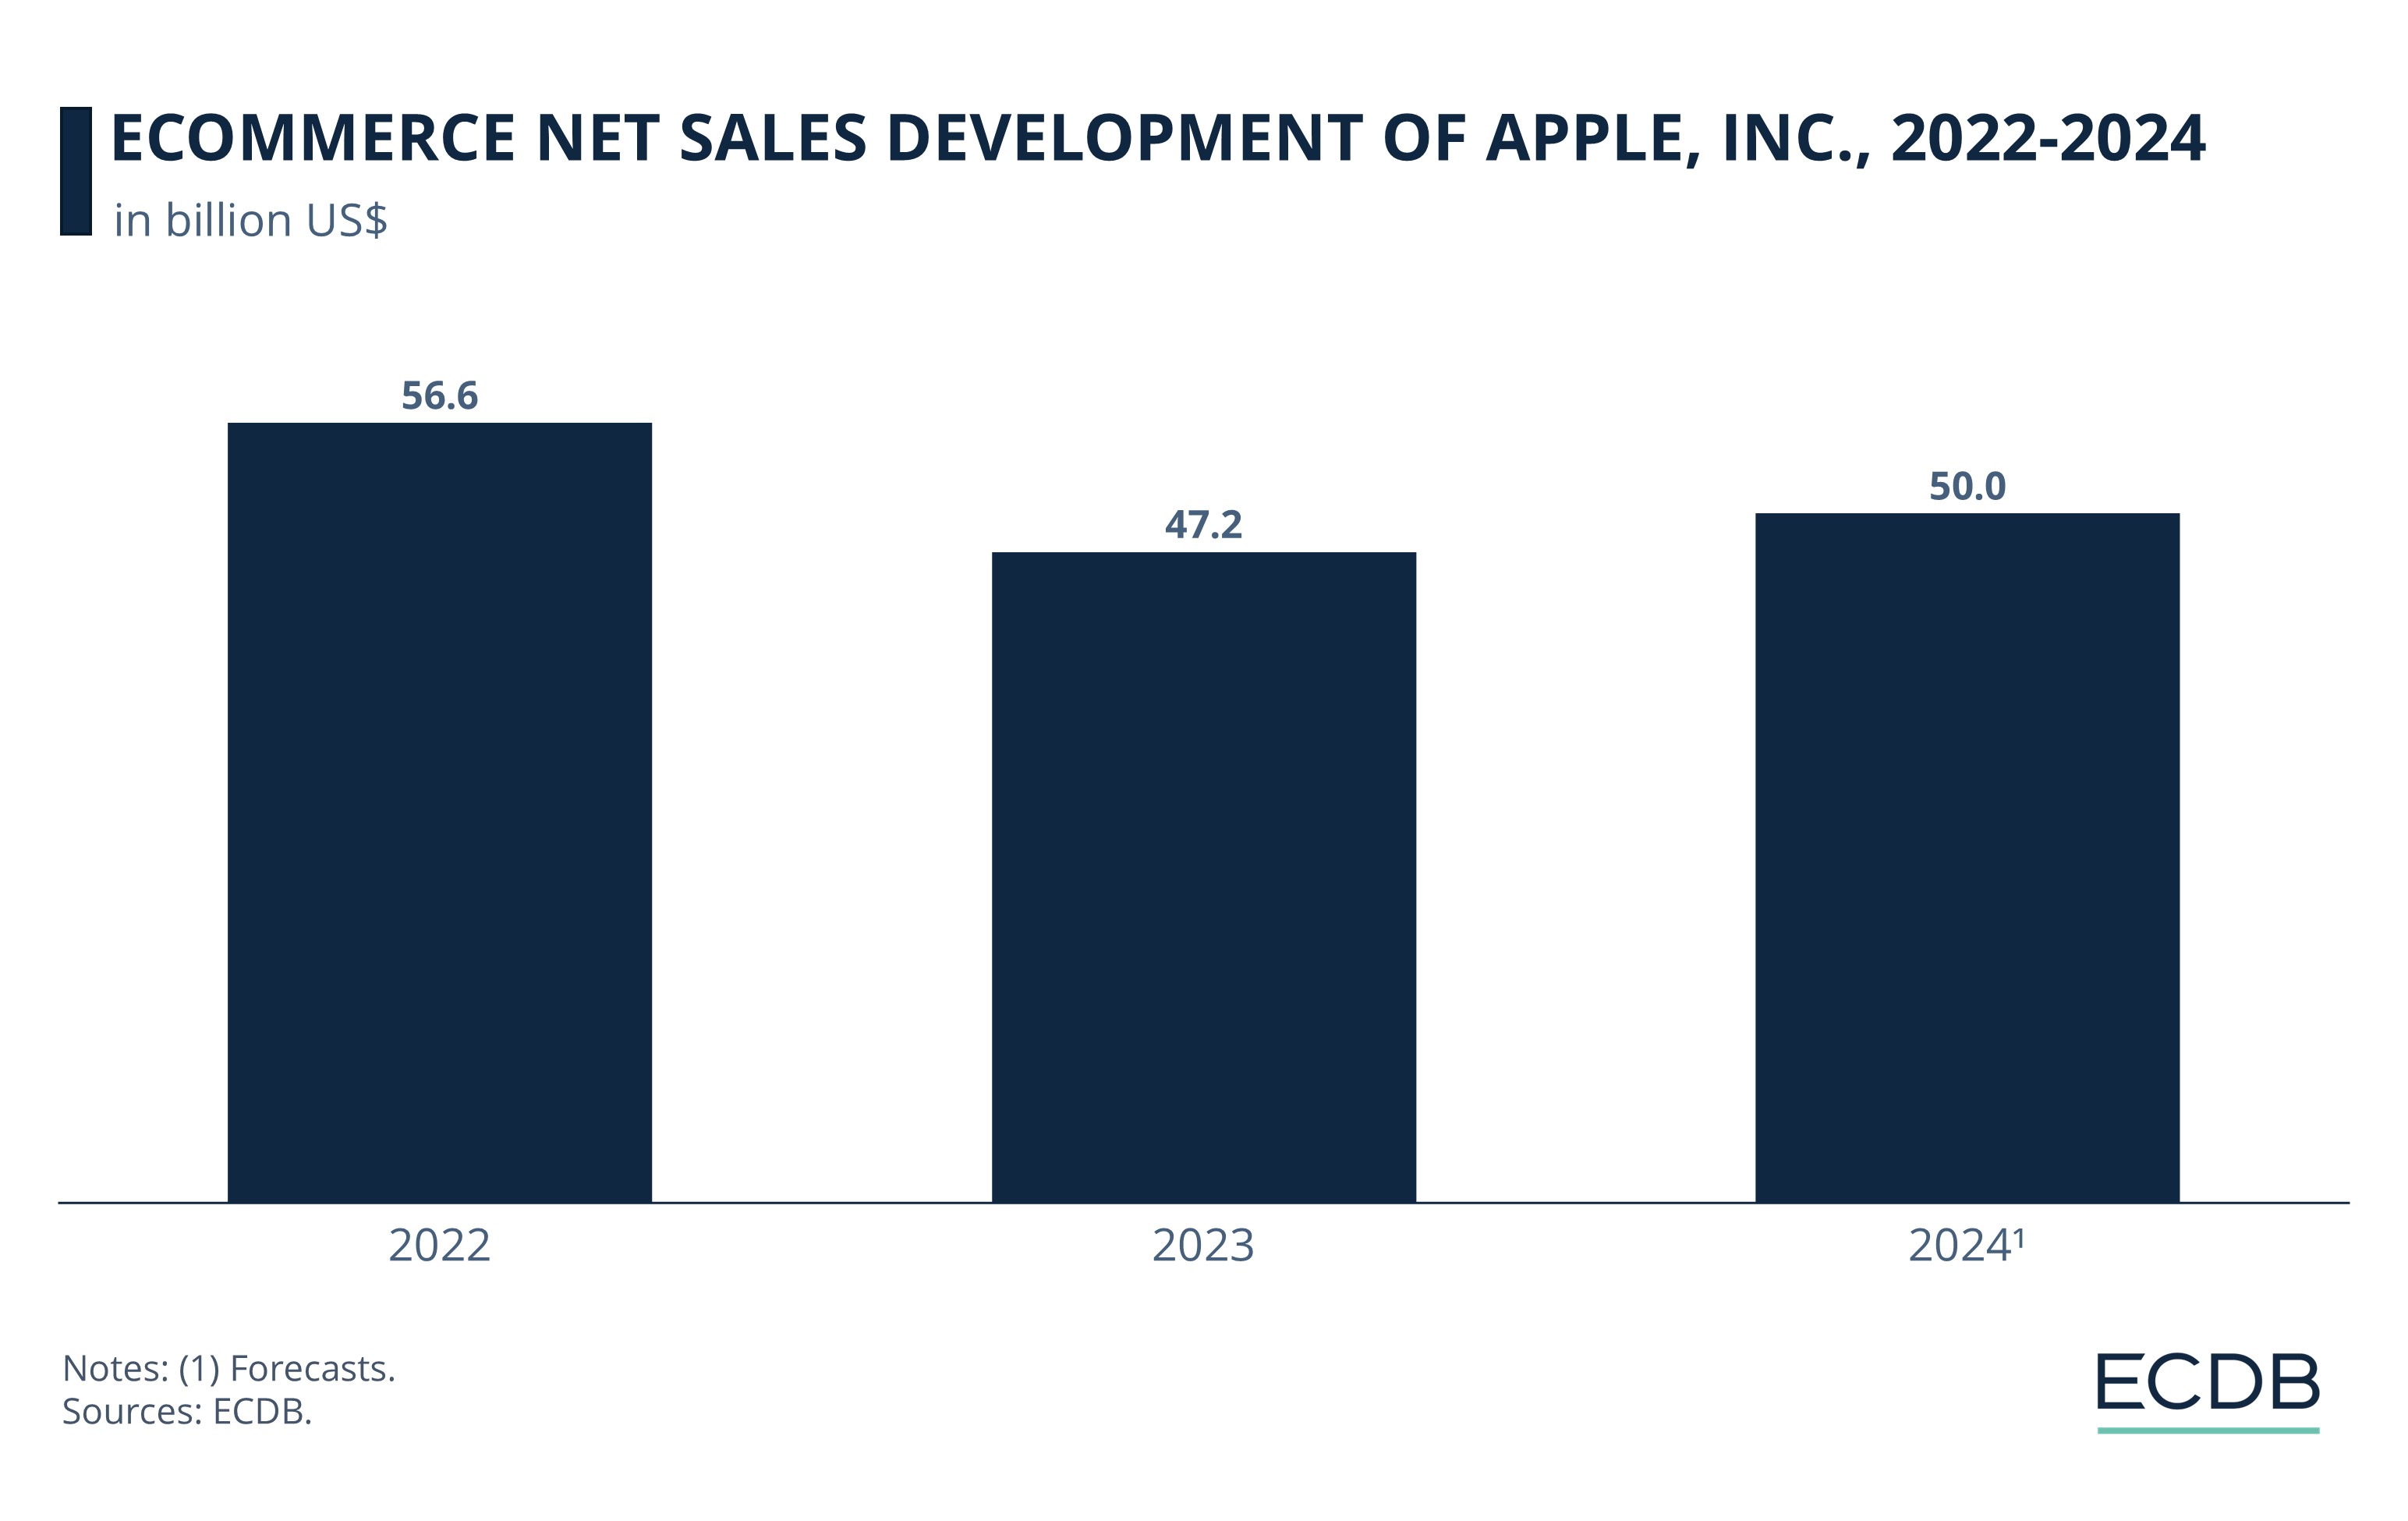
Prior to 2022, Apple’s online channels saw robust growth. Net sales more than doubled between 2019 and 2021. In 2021, while offline sales increased 28% year on year, online sales jumped by a massive 77%.
Growth slowed down to 10% in 2022. But the real challenge came in 2023, when Apple’s eCommerce sales plummeted to US$47.2 billion – lower than its pandemic peak. Reasons include the return to in-store shopping as well as a decline in discretionary spending amid inflation.
Recovery is expected in 2024, with online sales anticipated to reach US$50 billion.
Starting from 2022, Apple also resumed its brick-and-mortar focus. In 2023, it made an announcement to open over 50 stores by 2027, including in key cities across Asia-Pacific, Europe and the Middle East.
We chart the development of its online and offline share:
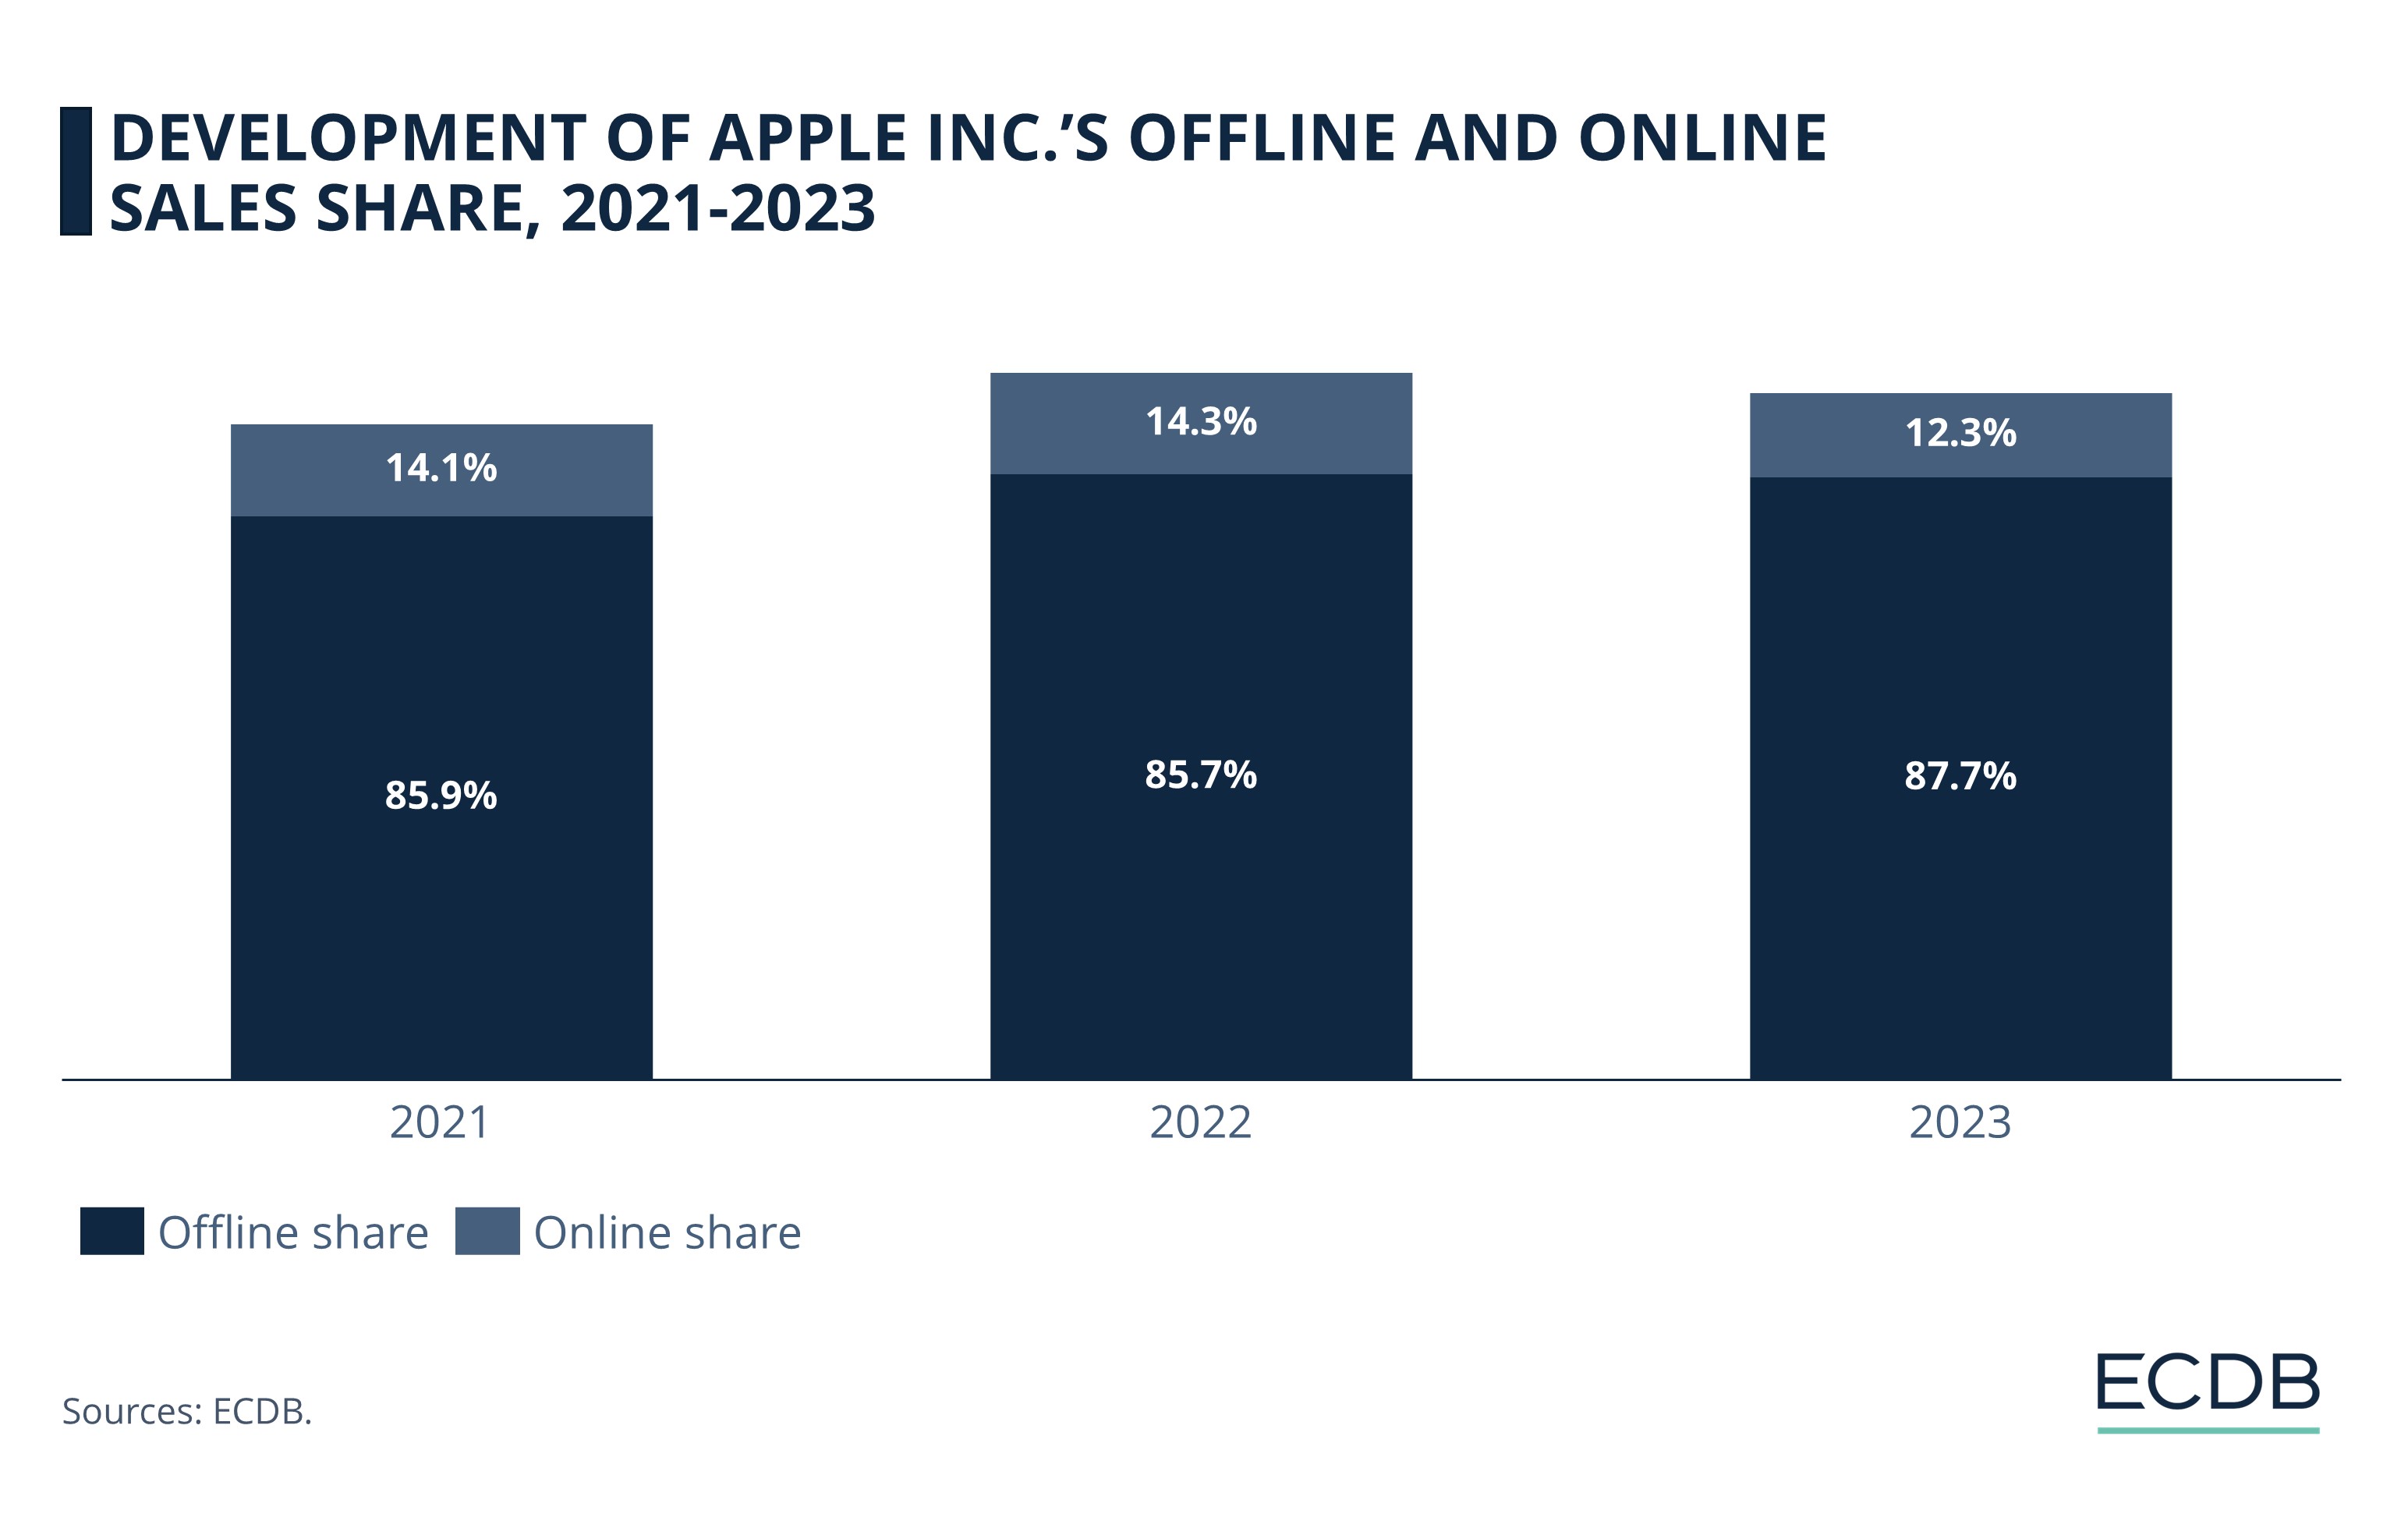
Online sales constituted over 14% of Apple’s revenues in 2022 – a significant improvement from 2019 (9.4%). The pandemic prompted Apple’s consumers to buy more online.
In the same duration that online sales gained ground, Apple’s offline sales share shrunk – from 90.6% in 2019 to 85.7% in 2022.
2023 saw a reversal. Offline sales share grew again, while online share declined by 2 percentage points.
Apple’s online store helped it reach consumers during the pandemic, and in regions where it does not have a physical presence. Adapting to each market – by integrating the local currency, language, and region-specific promotions – boosts its online presence.
Despite the period of surge in online sales, Apple’s offline sales have remained dominant. In addition to its own brick-and-mortar stores, Apple sells through third-party retailers and carriers. In fact, a new report from CIRP shows that most iPhone sales in the U.S. take place through wireless carriers, who are more readily accessible than Apple stores.
Stay Competitive: Our constantly updated rankings provide you with the latest insights to improve your business strategy. Discover which stores and companies are at the top of the eCommerce world and which categories are driving the highest sales. Dive into our rankings for companies, stores, and marketplaces. Stay a step ahead in the market with ECDB.
Apple Revenue by Region: United States Most Important Market
Per our ECDB data, Apple’s top markets by revenue share in 2023 were:
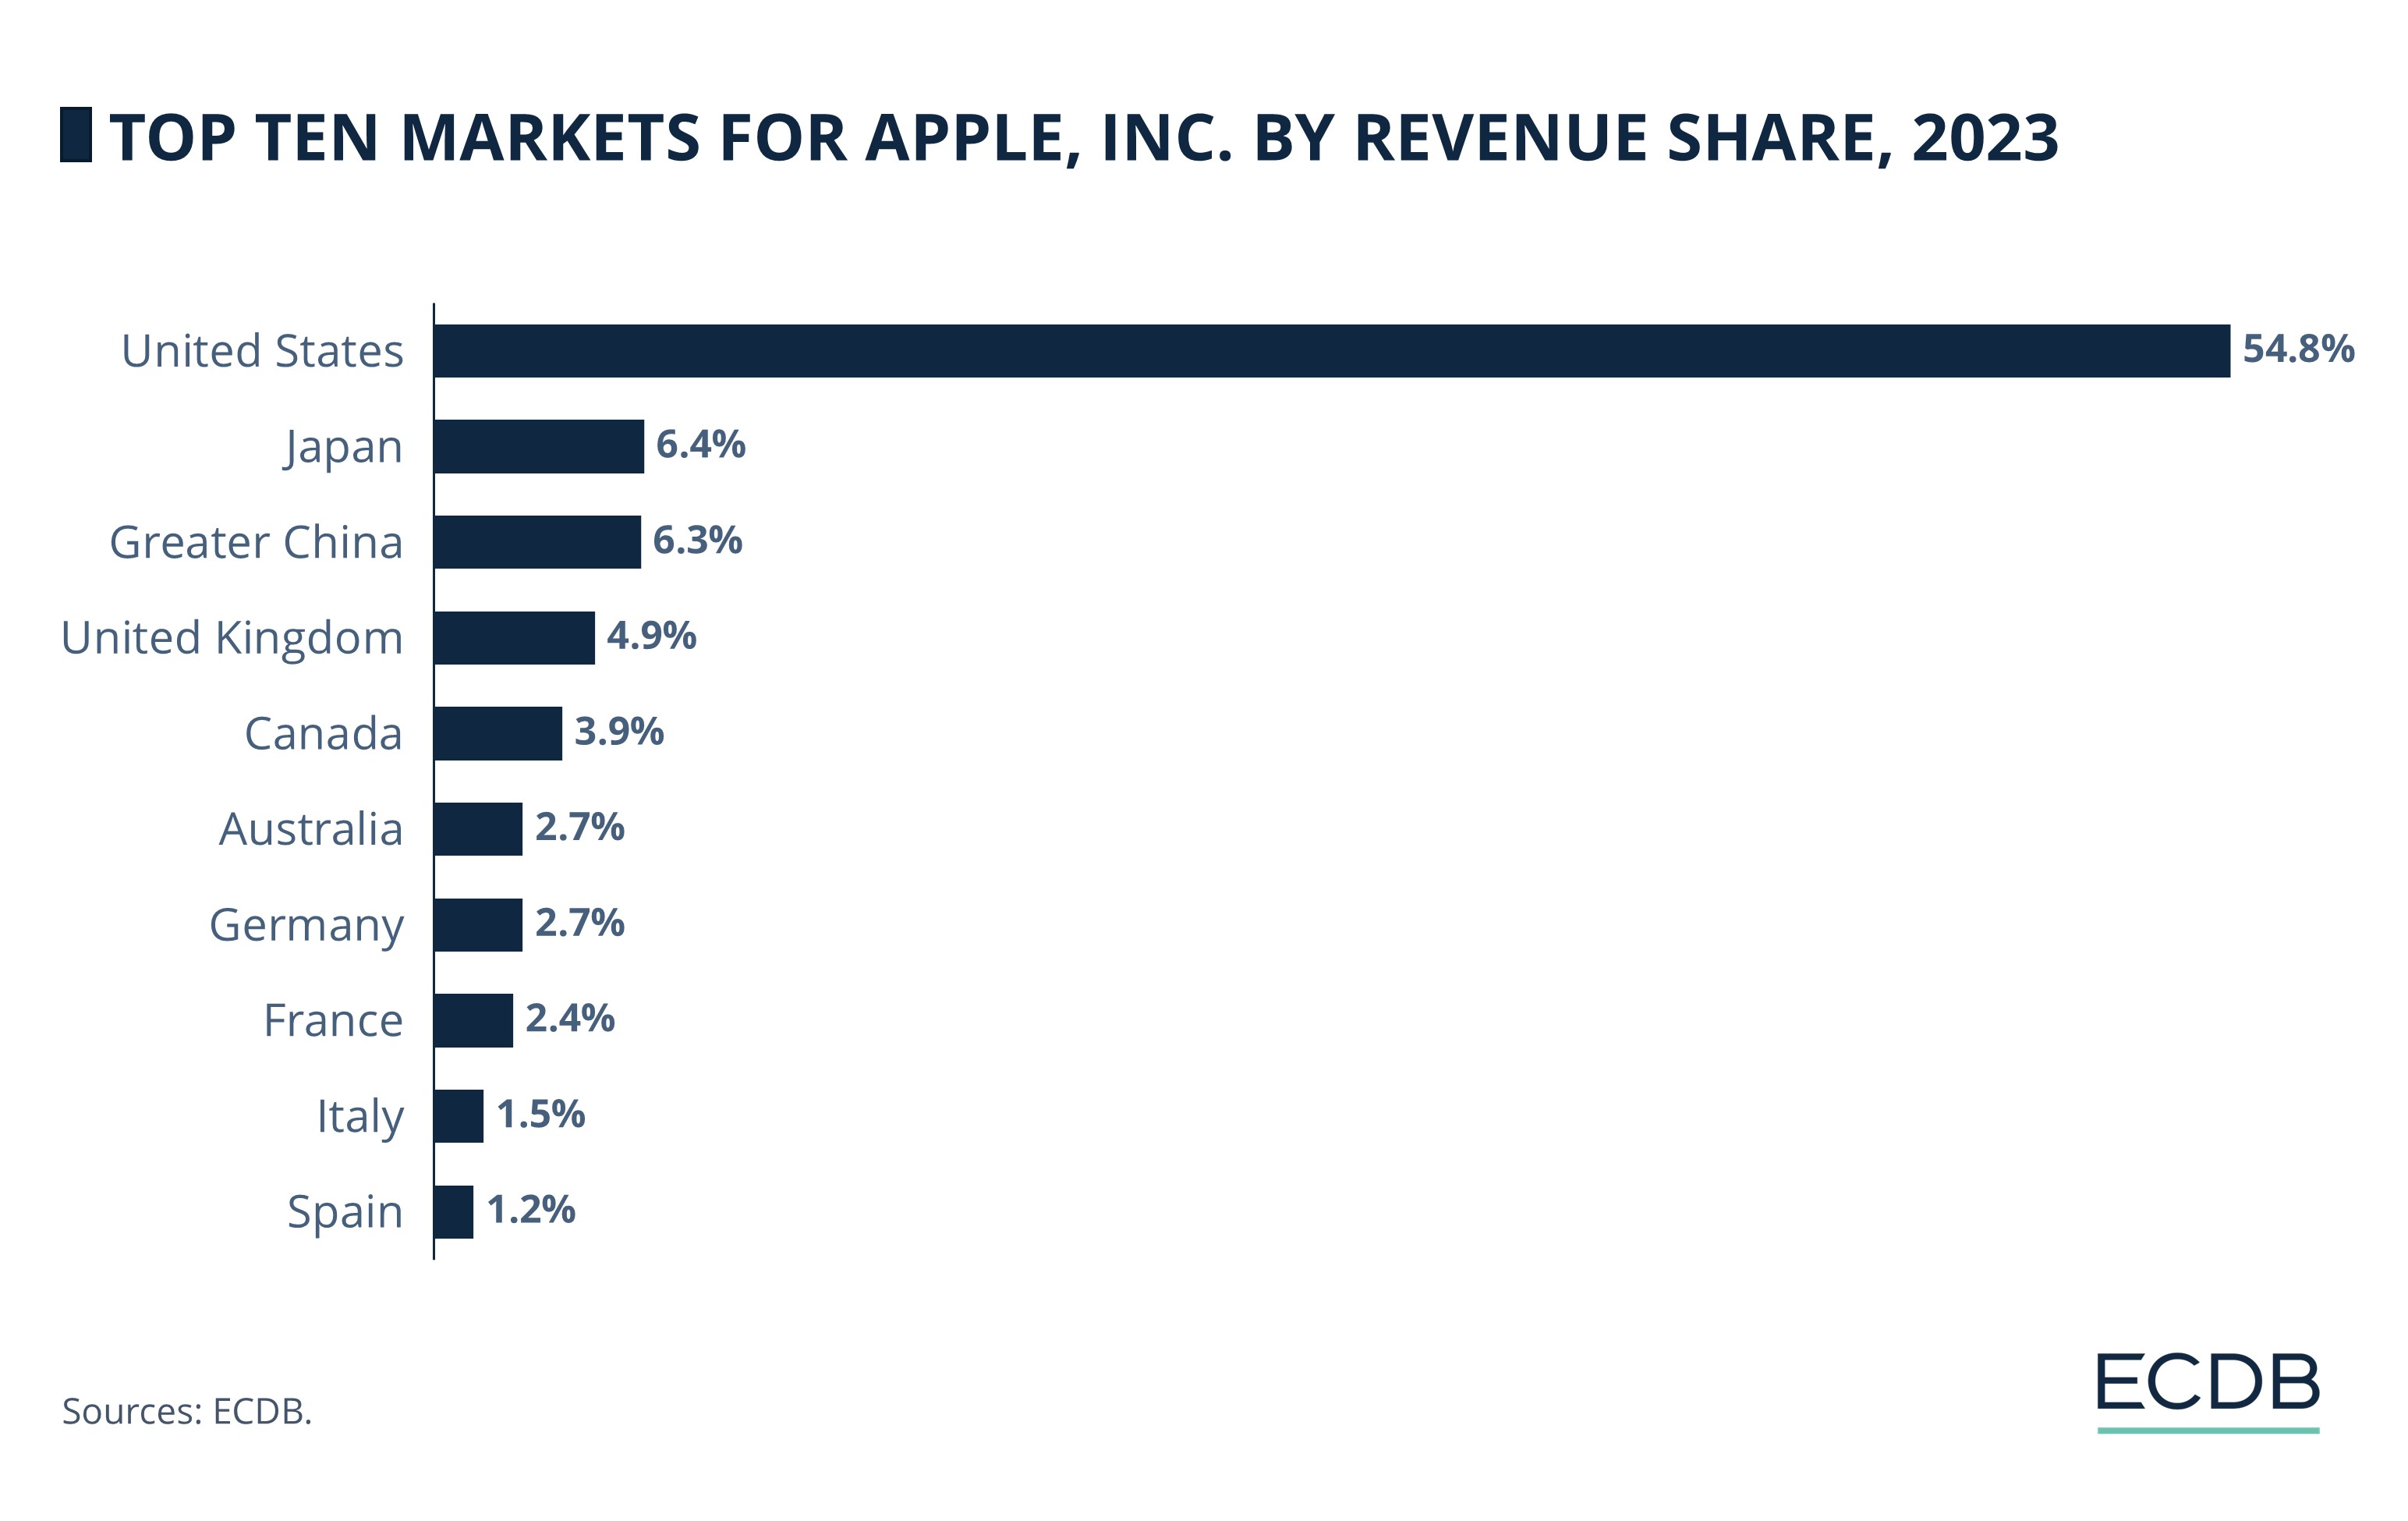
The United States, its home country, is the most profitable for Apple, Inc. It generates over half of its revenues (54.8%) in the U.S, where it is the fifth largest eCommerce company and has the greatest number of stores at 272.
Japan and China, from the Asia Pacific region, rank second and third. Their shares are much smaller in comparison, at just over 6%.
UK and Canada are next, with 4.9% and 3.9% respectively.
European markets including Germany, France, and Spain make up between 1.2%-2.7% of Apple’s net revenue.
Apple’s overall performance hinges on its key market, the United States. Changes in the economic climate and consumer spending in the country, therefore, have a significant impact on its revenues.
Nevertheless, Apple has diversified more in terms of its business segments.
Apple Revenue by Segment: Products Earn More, But Services Grow Faster
Apple’s business is divided into two core segments: products and services. Both these areas have evolved over the years:
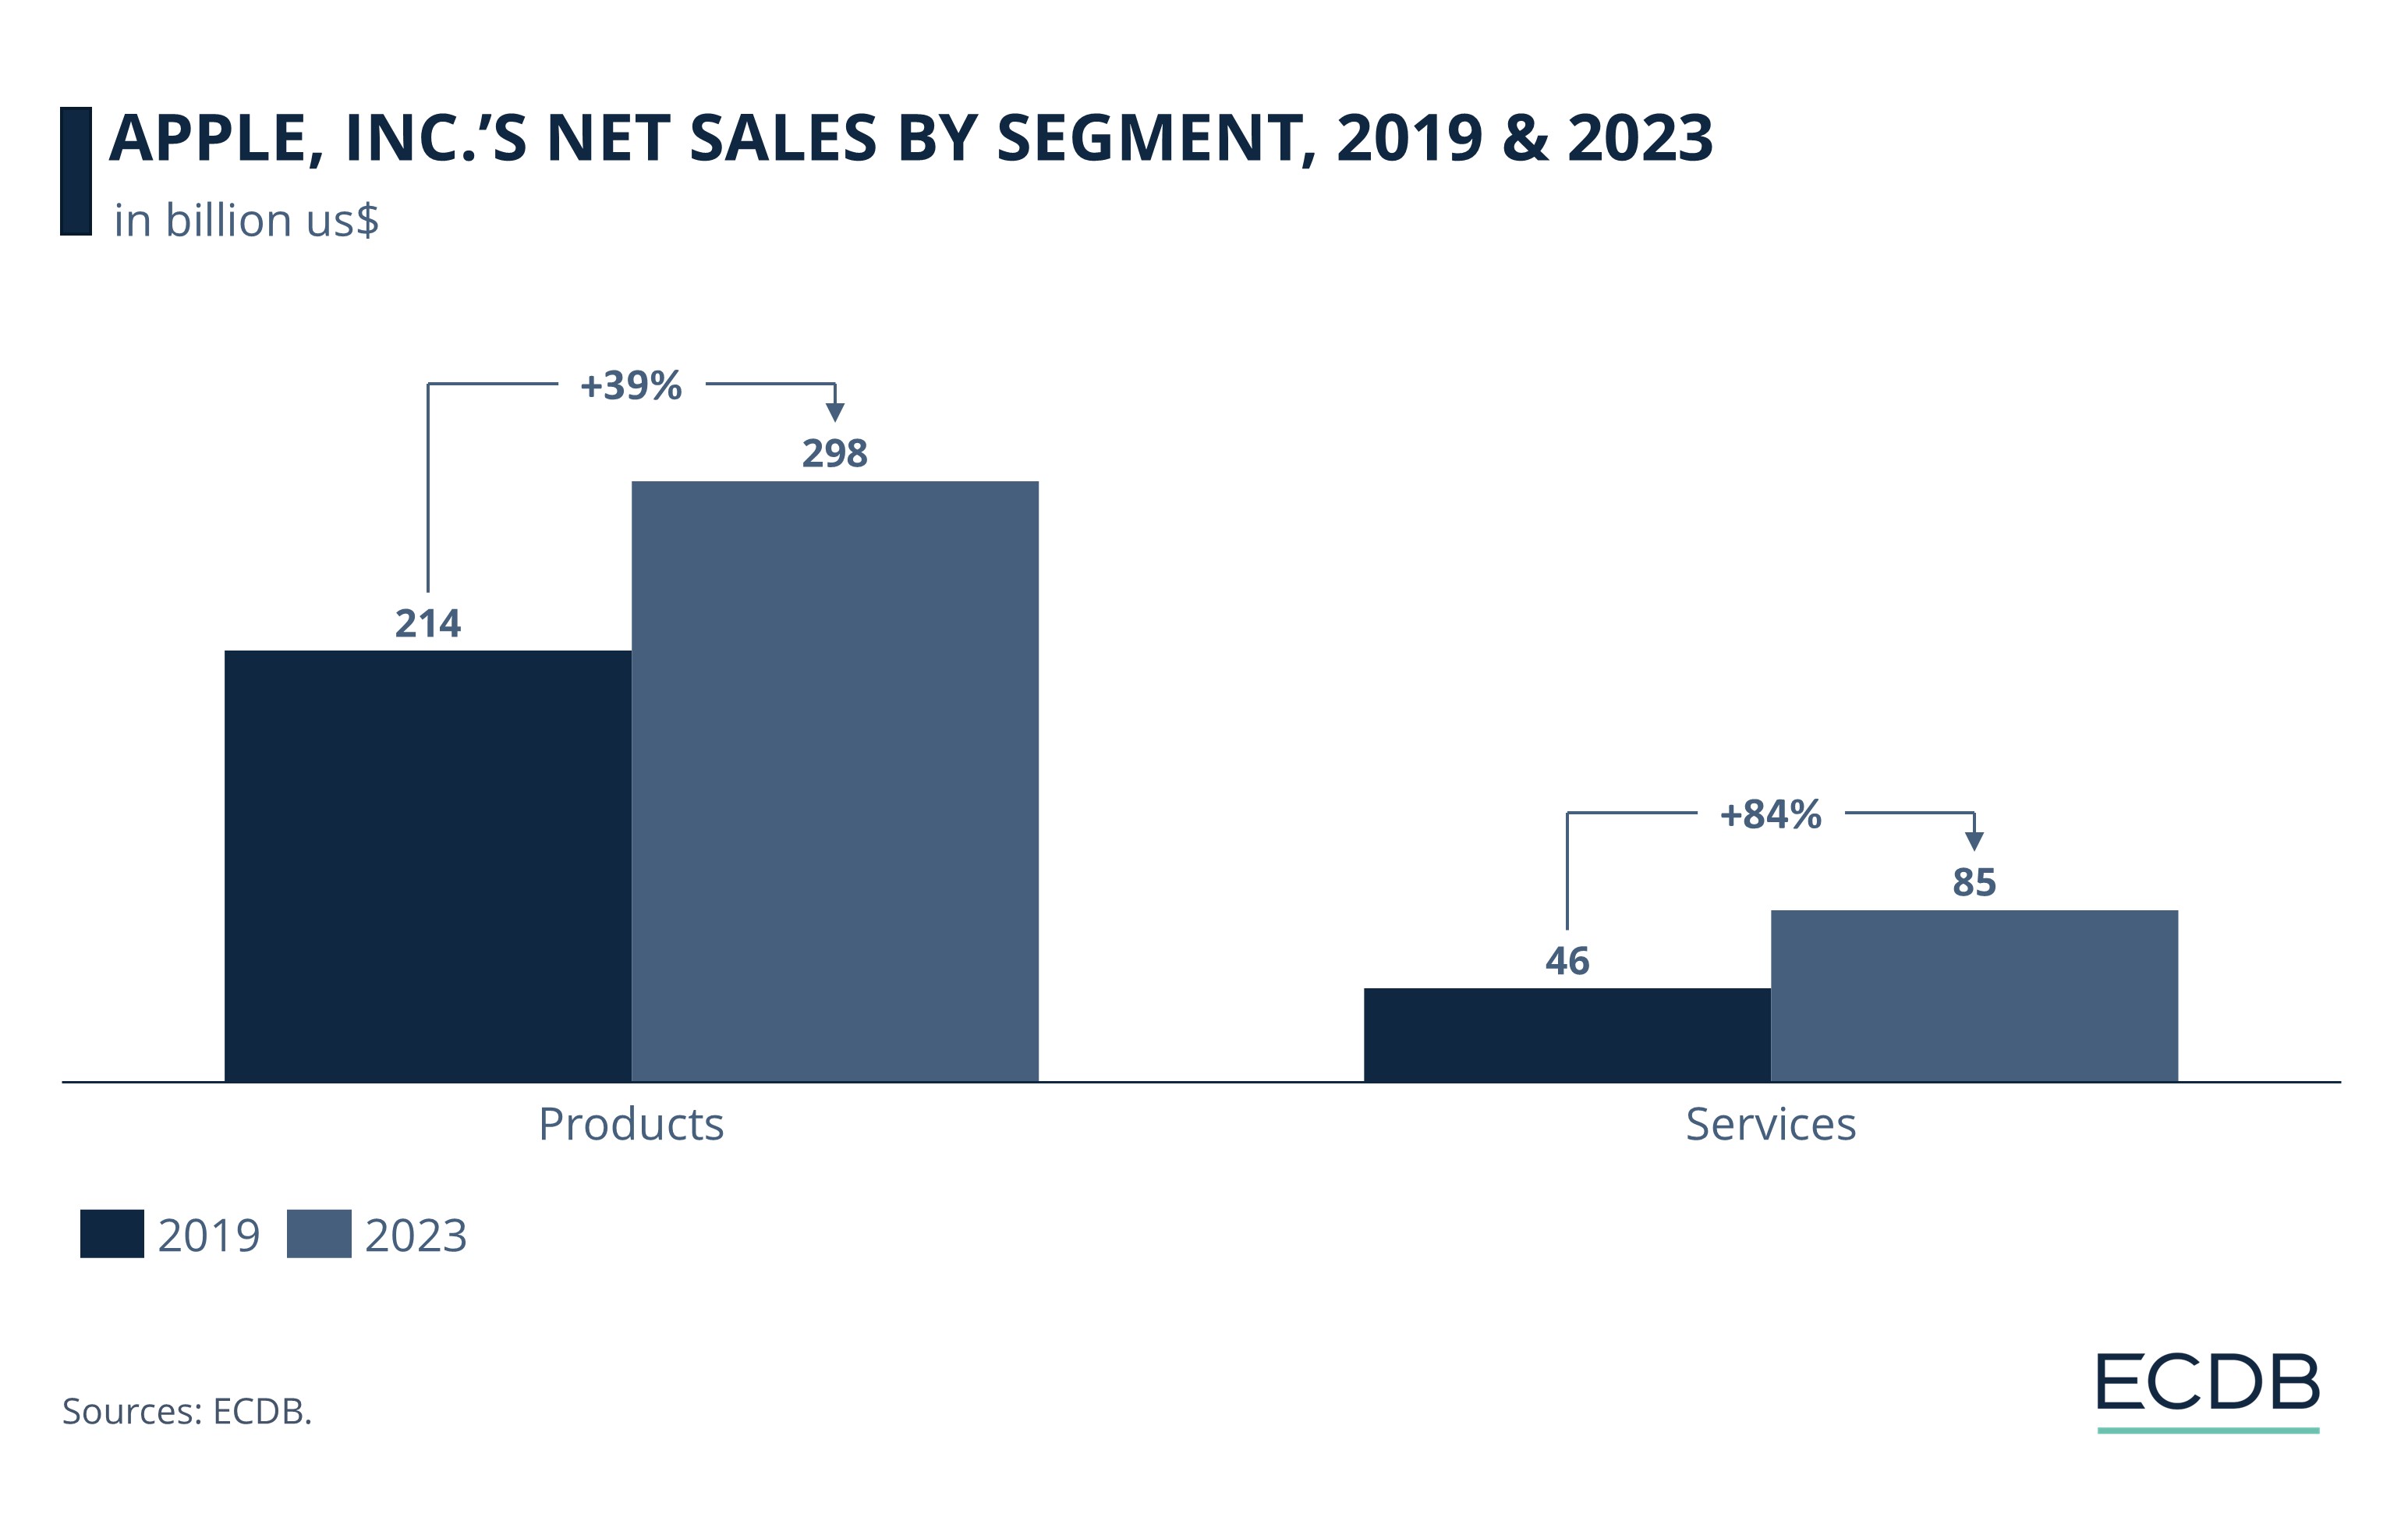
In 2019, Apple’s products contributed more than four times to its net sales than the services segment. Product net sales were US$214 billion in 2019, while services sales were US$46 billion.
By 2023, product net sales rose to US$298 billion, while services net sales reached US$85 billion.
From a growth perspective, Apple’s services segment (84%) grew more rapidly between 2019 and 2023 compared to its products (39%).
Data shows that in absolute numbers, Apple’s products still drive most of its sales. But in terms of growth, the services segment has outperformed products, particularly in the last two years.
The company’s focus on services may allow them to contribute more significantly to total revenues going forward. As of now, their share in net revenues remains relatively limited.
Apple Revenue by Product Category: iPhone is the Top Performer
When we look at performance by product category, data reveals the importance of one product in particular: the iPhone.
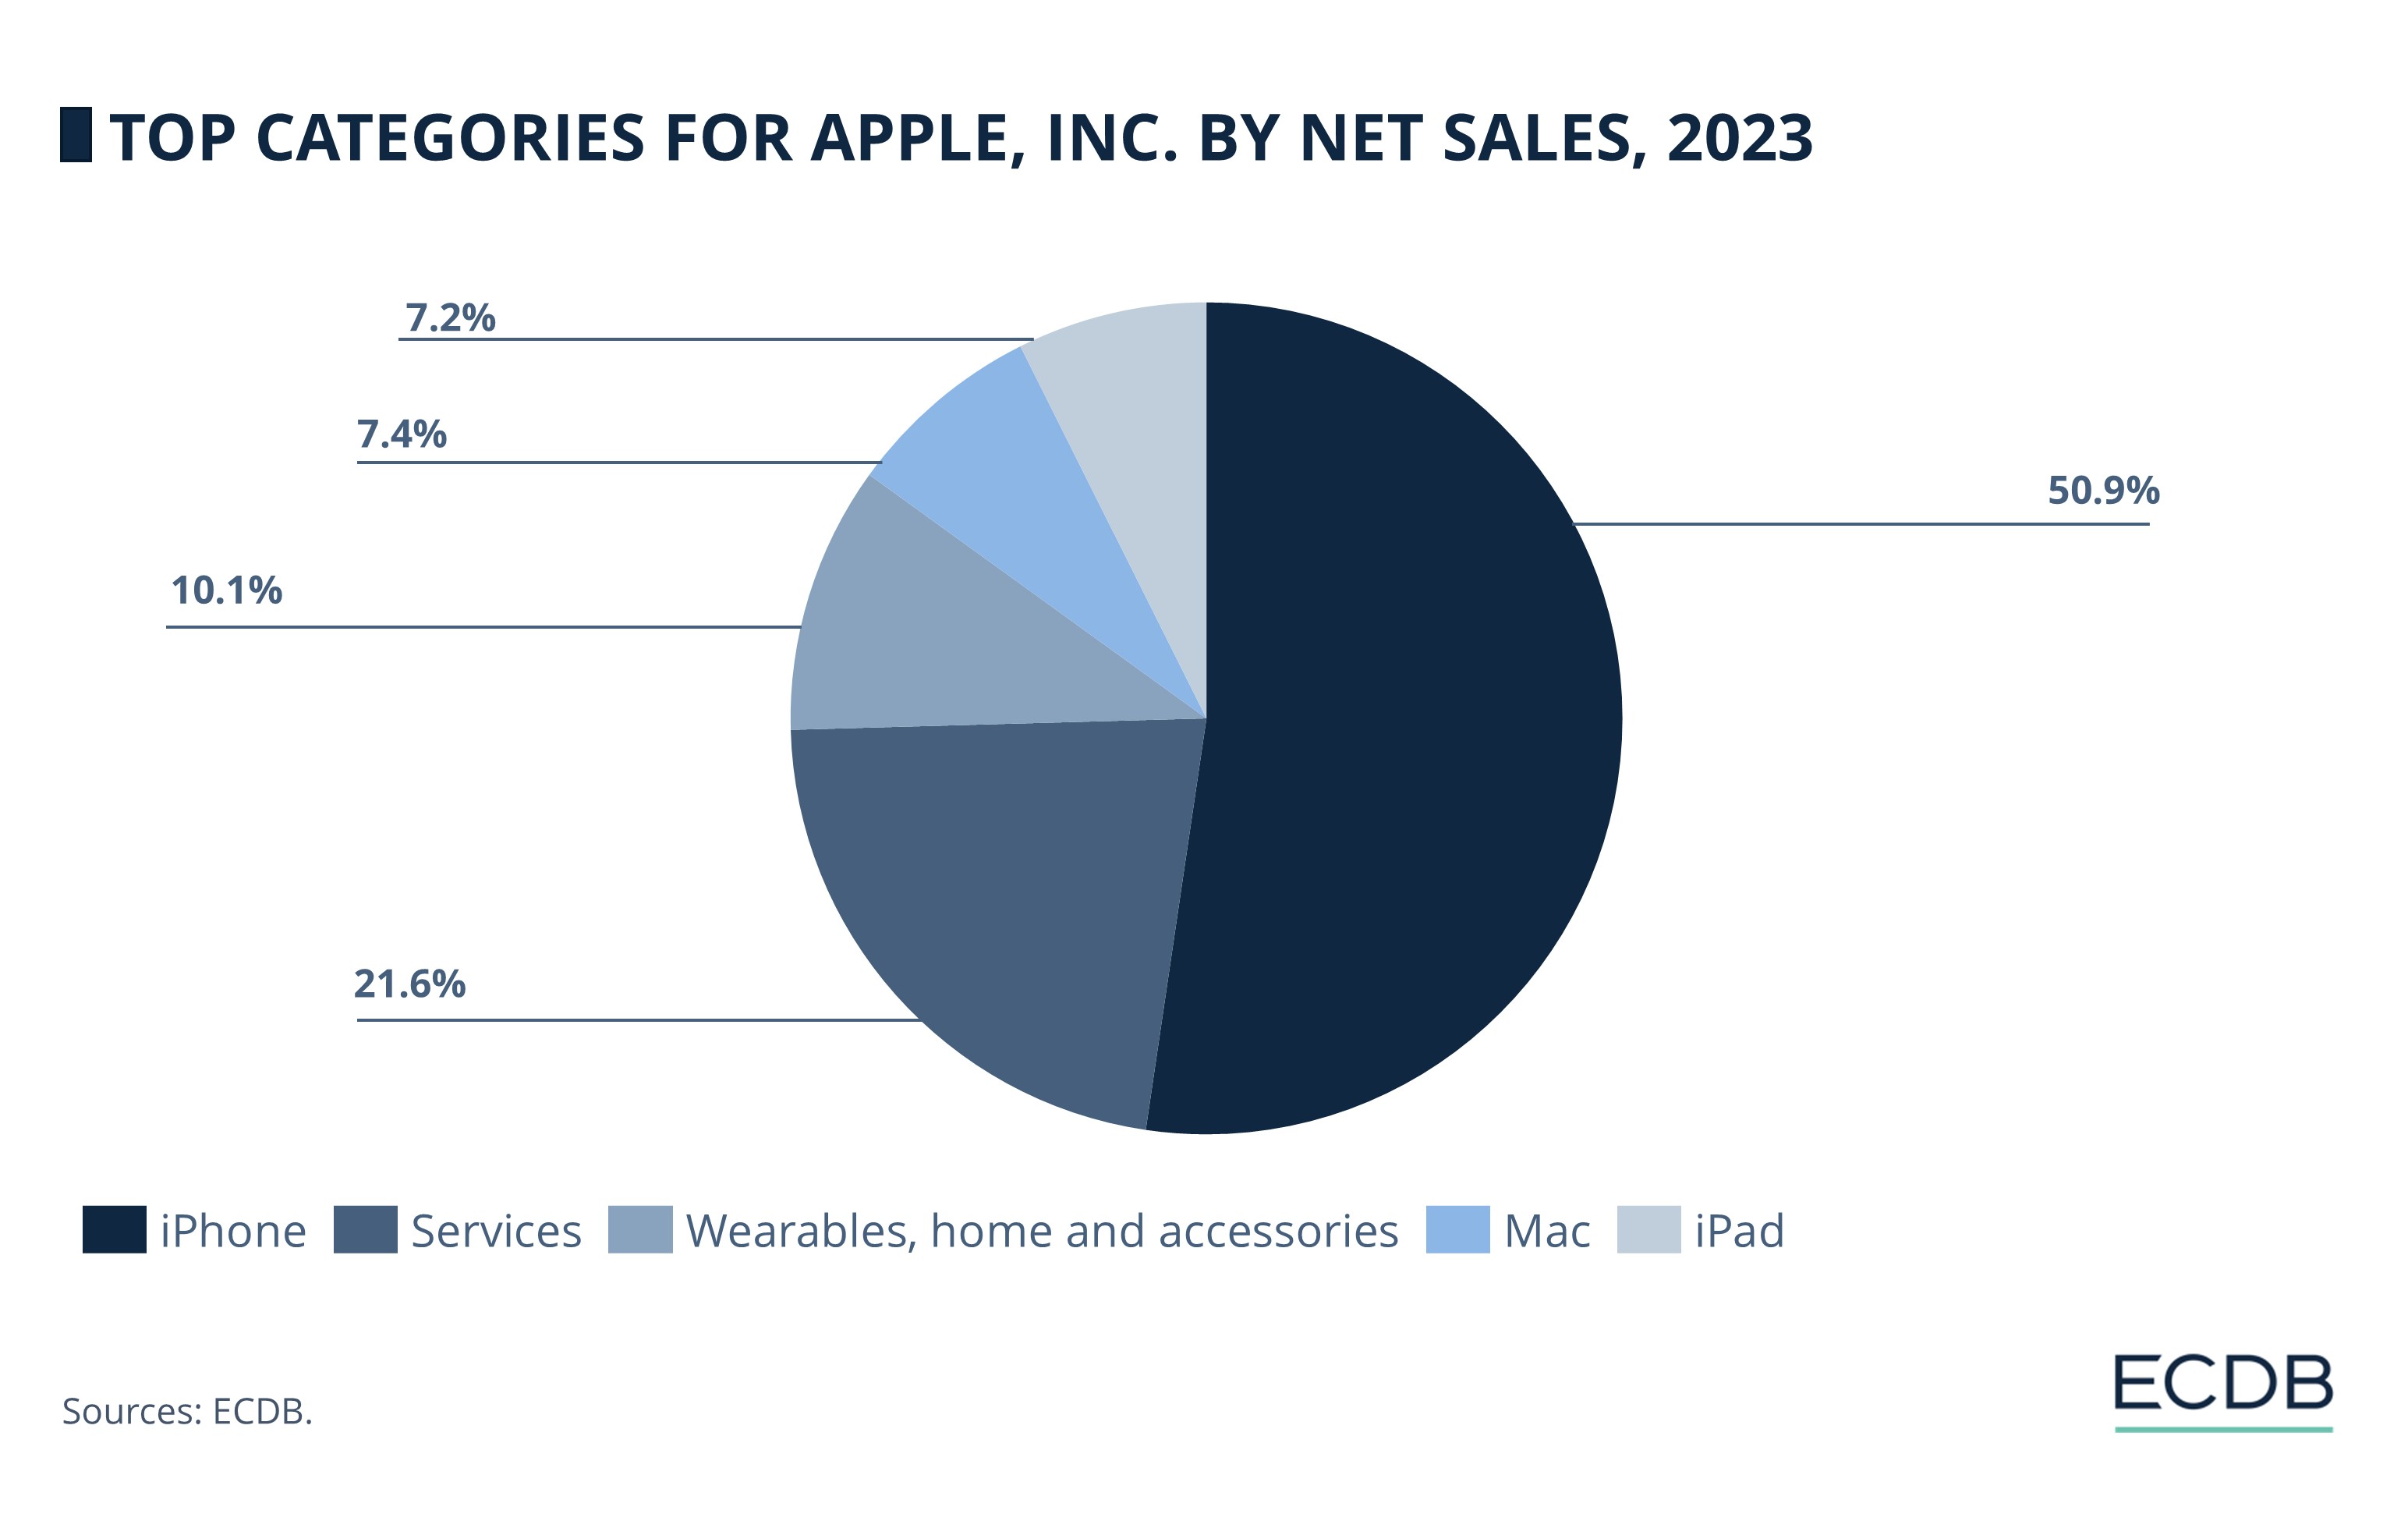
iPhone constituted over half of Apple’s net sales in 2023, at 50.9%.
Services are next, with 21.6%. Examples include music, movies, TV shows, and app purchases (from the iTunes Store, App Store, and Book Store).
Wearables, home and accessories are third largest, with 10.1%. Examples are Apple Watch, AirPods, and HomePod.
Mac is next, with 7.4%.
iPad is the smallest category, at 7.2%.
The iPhone remains Apple’s flagship product and is a critical driver of its revenue. However, the sales trajectory of iPhones has seen fluctuations in recent years, reflecting global shifts.
iPhone Performance: Net Sales at US$200.6 Billion in 2023
iPhone sales saw inconsistent growth from 2021 to 2023:
The iPhones market underwent a yearly decrease of 3% in 2020. But a resurgence was observed in the following year.
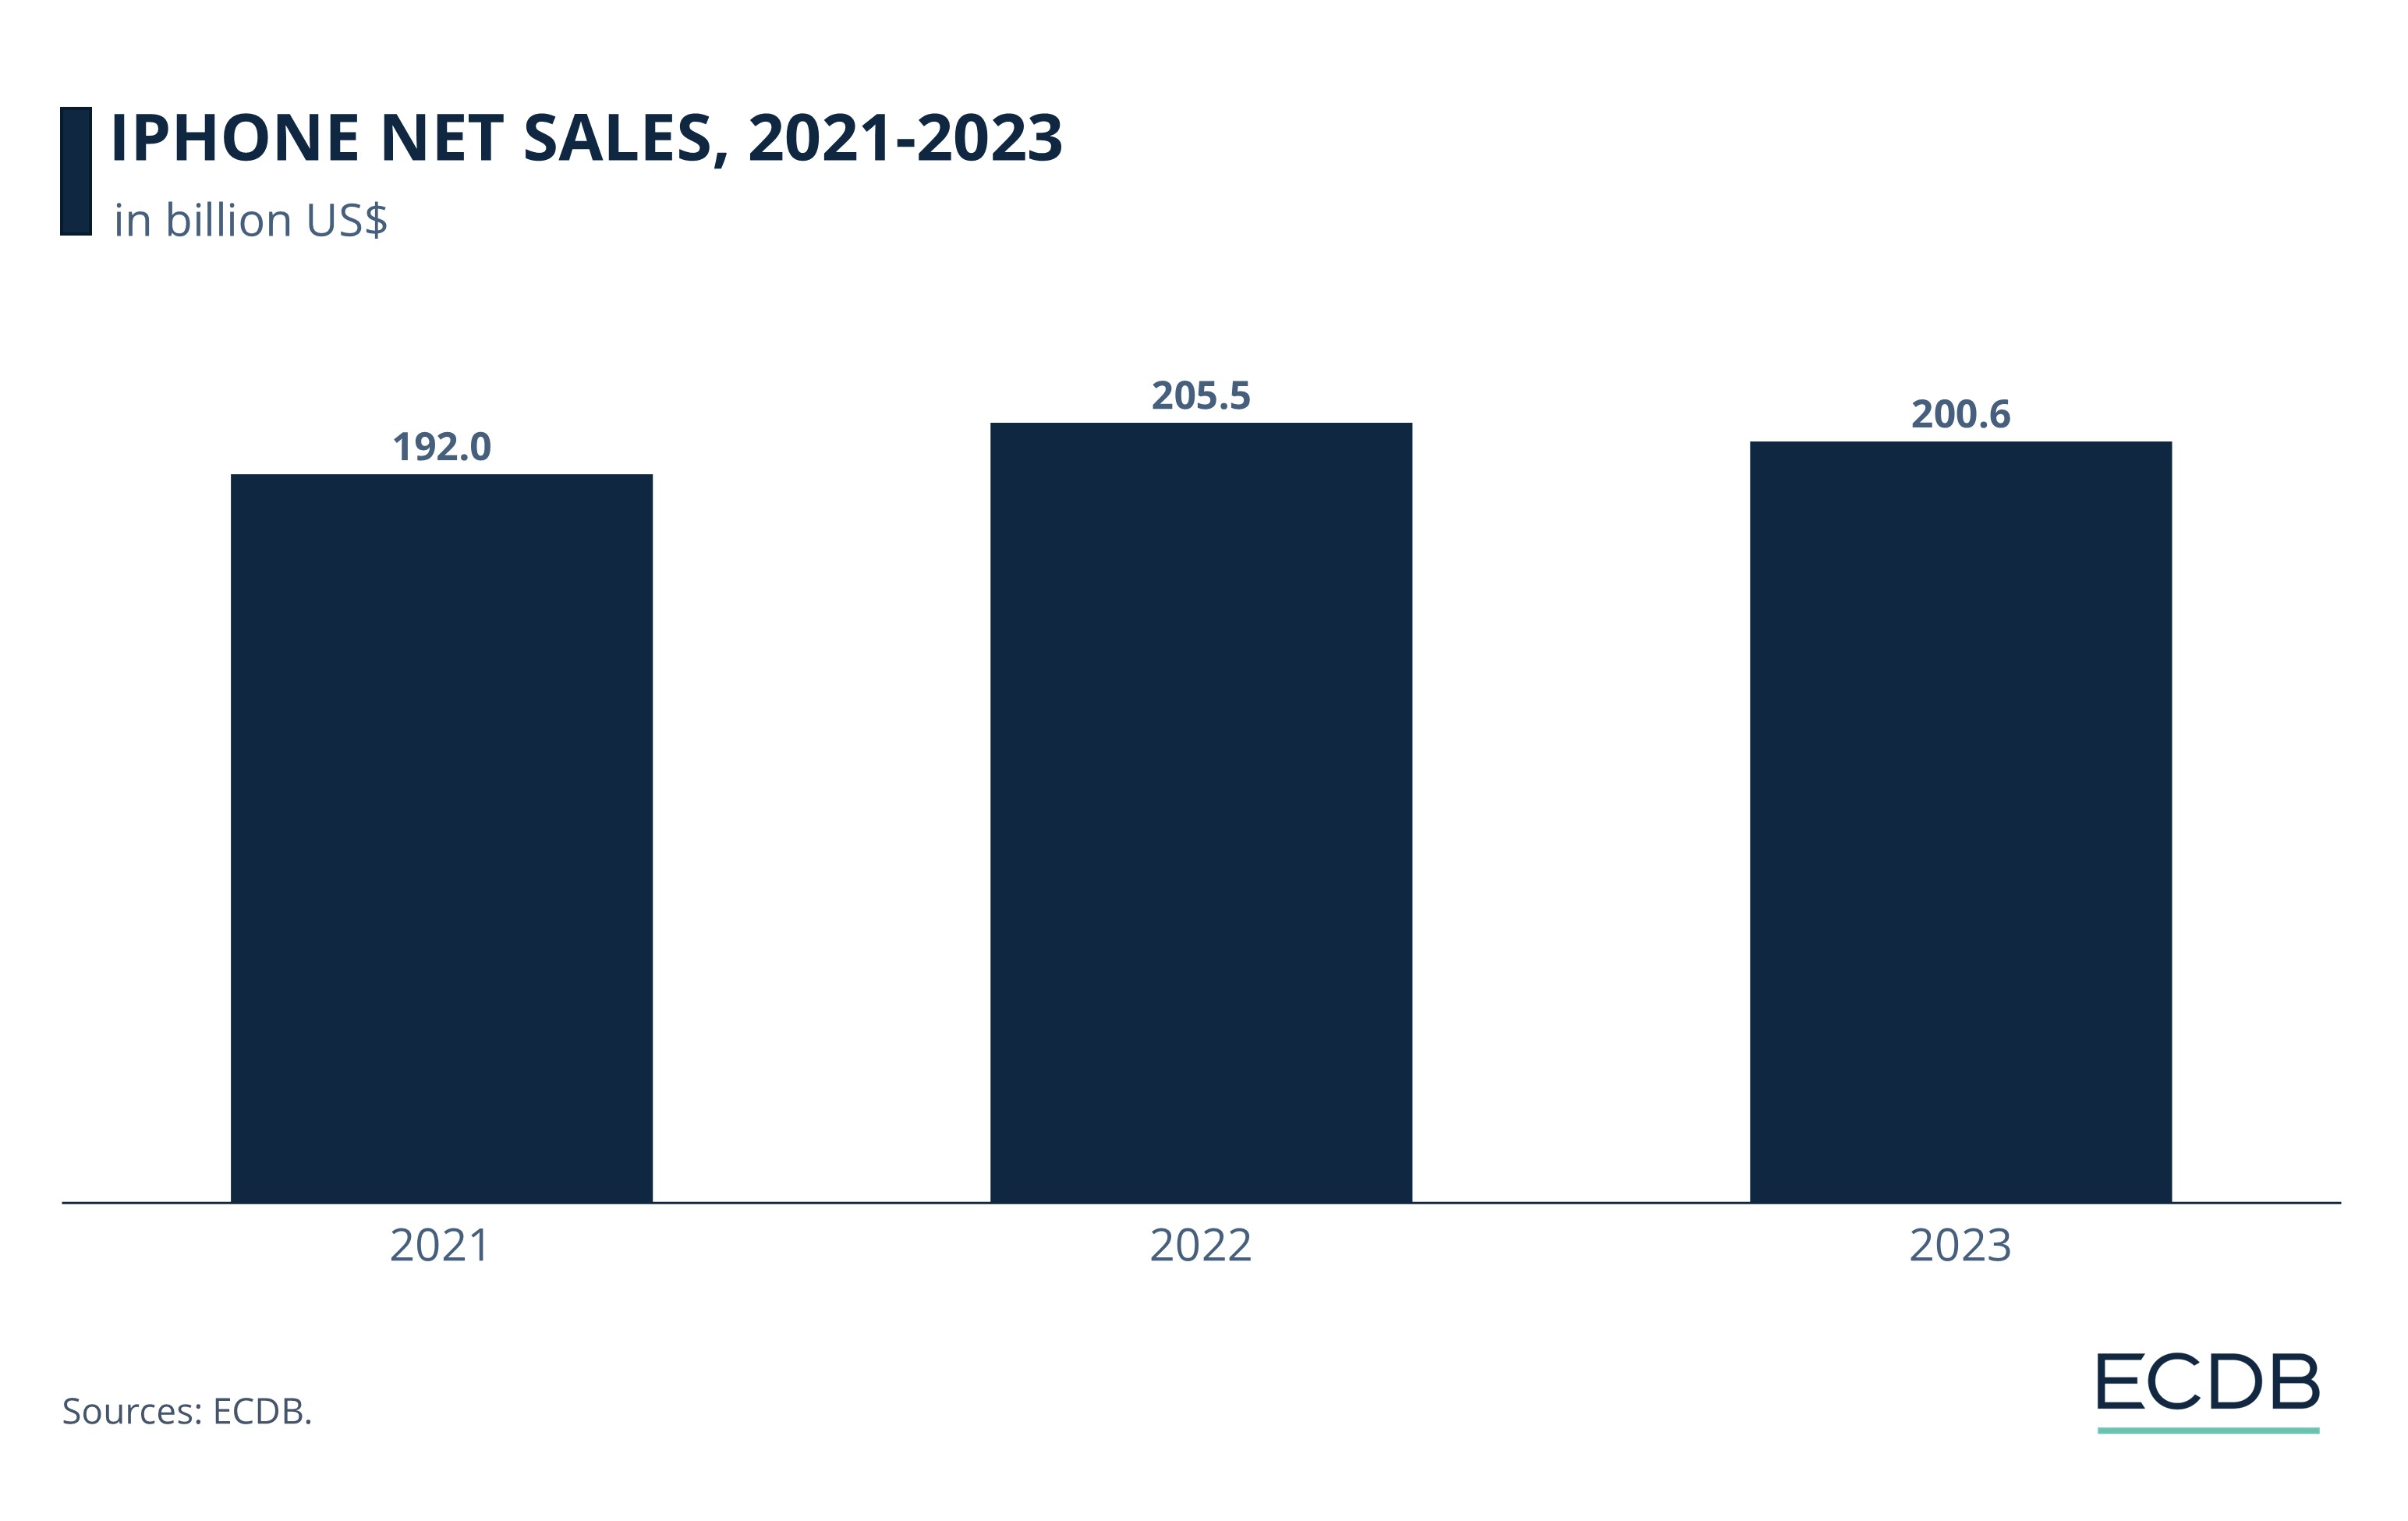
With an impressive year-on-year growth of 39%, iPhone sales hit US$192 billion in 2021.
A modest increase of 7% occurred in 2022, followed by a decline of 2% in 2023, when sales stagnated at US$200.6 billion.
The global onset of Covid-19 disrupted supply chain and logistics in 2020. Consumer demand was also restrained, as people held back on big-ticket purchases. This also mirrored the broader trend in the global smartphones market in this year, which had slower growth than comparable products like desktop PCs and laptops.
Conditions for Apple improved in 2021, thanks to the new iPhone 12 release. There was also a rebound in demand as economies opened and many consumers who had delayed upgrading in 2020 rushed to purchase new iPhones. But from 2022 onwards, factors like global inflation and reduced discretionary spending once more impacted sales.
Apple’s Revenues: Closing Thoughts
Apple’s revenues declined in 2023, with likely reasons being the economic climate and lower iPhone sales. Most of Apple’s revenues come from offline channels, which includes its own brick-and-mortar stores, omnichannel sales, and carriers.
The United States is Apple’s main market, and iPhones contribute the lion’s share to the company’s sales. This over-reliance on one key market and one product may restrict growth opportunities going forward. While Apple has diversified in terms of its segments, it must be scaled more significantly as competition mounts.
Samsung is a formidable competitor. In Q1 2024, it became the top smartphone by worldwide shipments, surpassing Apple, according to IDC. Moreover, the demand for the latest iPhone 16 was lower than expected, likely because of the lack of AI features, which both Samsung and Google have integrated. The developments indicate that Apple must both innovate and diversify to maintain its domination in the market.
Click here for
more relevant insights from
our partner Mastercard.
Related insights
Deep Dive
Online Shopping in the United States: Where Consumers Prefer to Shop Online
Online Shopping in the United States: Where Consumers Prefer to Shop Online
Deep Dive
Top Online Payment Methods in the United Kingdom: Cards & eWallets
Top Online Payment Methods in the United Kingdom: Cards & eWallets
Deep Dive
eCommerce in the United States: Top 5 Companies by Revenue
eCommerce in the United States: Top 5 Companies by Revenue
Deep Dive
Top 10 Online Shopping Sites in the USA: Amazon, Walmart, Apple
Top 10 Online Shopping Sites in the USA: Amazon, Walmart, Apple
Deep Dive
Visa and Mastercard: Click-to-Pay Feature to Simplify the Payment Process
Visa and Mastercard: Click-to-Pay Feature to Simplify the Payment Process
Back to main topics