eCommerce: Top Product Categories
eCommerce in the United States: Best Product Categories
In 2023, five product categories in the U.S. eCommerce market have significantly increased their sales. Among them are sectors such as food, gardening and personal care. How have eCommerce categories evolved in the United States and what can be expected?
Article by Antonia Tönnies | October 14, 2024Download
Coming soon
Share

eCommerce in the United States: Key Insights
Food Category Leads in Growth: The food category saw the highest annual growth at 16.7% in 2023, driven by the convenience of online grocery shopping and rapid delivery options like qCommerce.
Market Stability & Future Projections: Though growth rates have moderated since 2020, the U.S. eCommerce market is projected to expand across categories, with steady CAGR forecasts (8-16%) suggesting sustained consumer demand for online shopping through 2028.
Category Leaders Driving Trends: Major online retailers such as walmart.com, and amazon.com are dominant forces across sectors like food, garden, personal, and household care, contributing significantly to the ongoing growth of these categories.
The United States is the second-largest eCommerce country in the world, just behind its biggest competitor, China. In 2023, the U.S. market reached a total revenue of US$981 billion. In the same year, five product categories in particular experienced strong growth, contributing significantly to the overall positive development of U.S. eCommerce.
Which product categories are these? How have they developed in recent years, and what can we expect in the future? ECDB has the data.
Top Product Categories in the U.S.:
Food Grew the Most
In 2023, the following product categories grew the most compared to their performance in 2022:
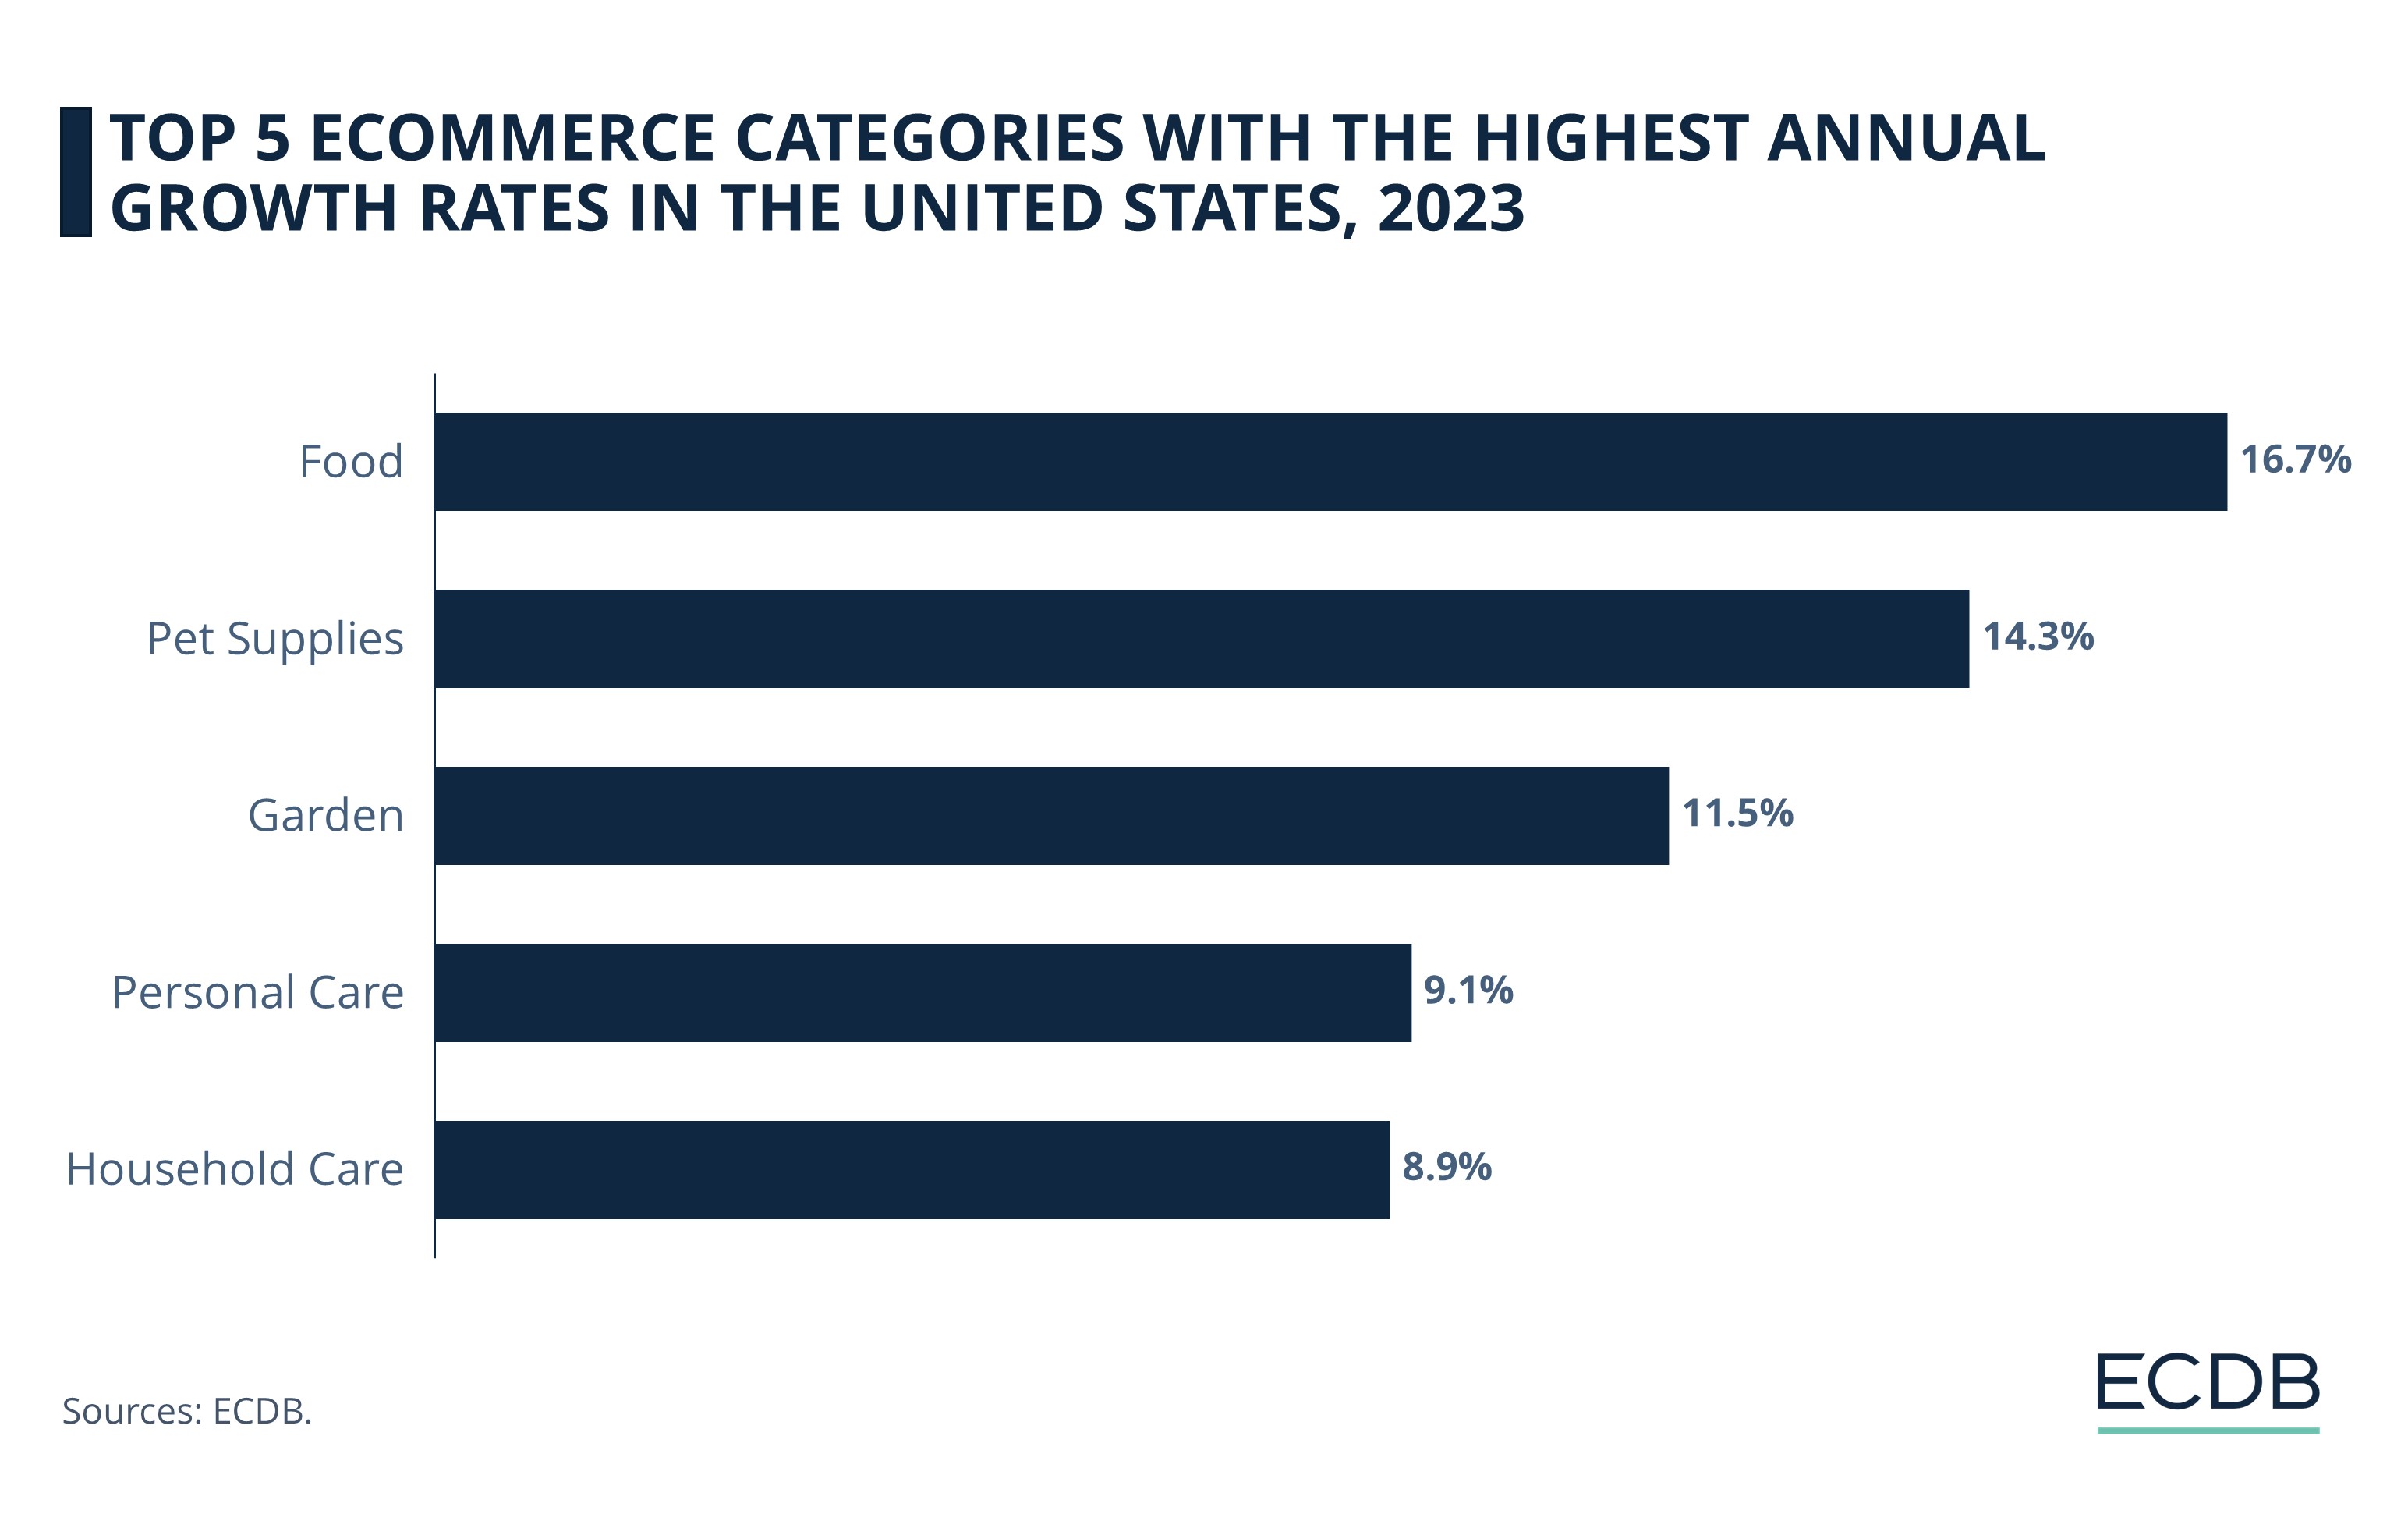
The Food category experienced the highest year-over-year growth in 2023 at 16.7% followed by Pet Supplies at 14.3%.
In third place is the product category Garden, with an annual growth rate in the U.S. of 11.5%.
Lastly comes Personal Care with an annual growth rate in the U.S. of 9.1%, closely followed by Household Care at 8.9% in 2023.
How have these product categories developed in the past? What can we expect from them in the future?
1. Food (16.7%)
Online grocery shopping has become a habit that many people can't live without. Instead of going to the grocery store after a stressful day at work and waiting in line, online stores do the job.
In addition, quick commerce, or qCommerce, has made food delivery even faster. Users save time and typically receive food in less than 30 minutes. This development is helping the development of the food eCommerce market in the United States:
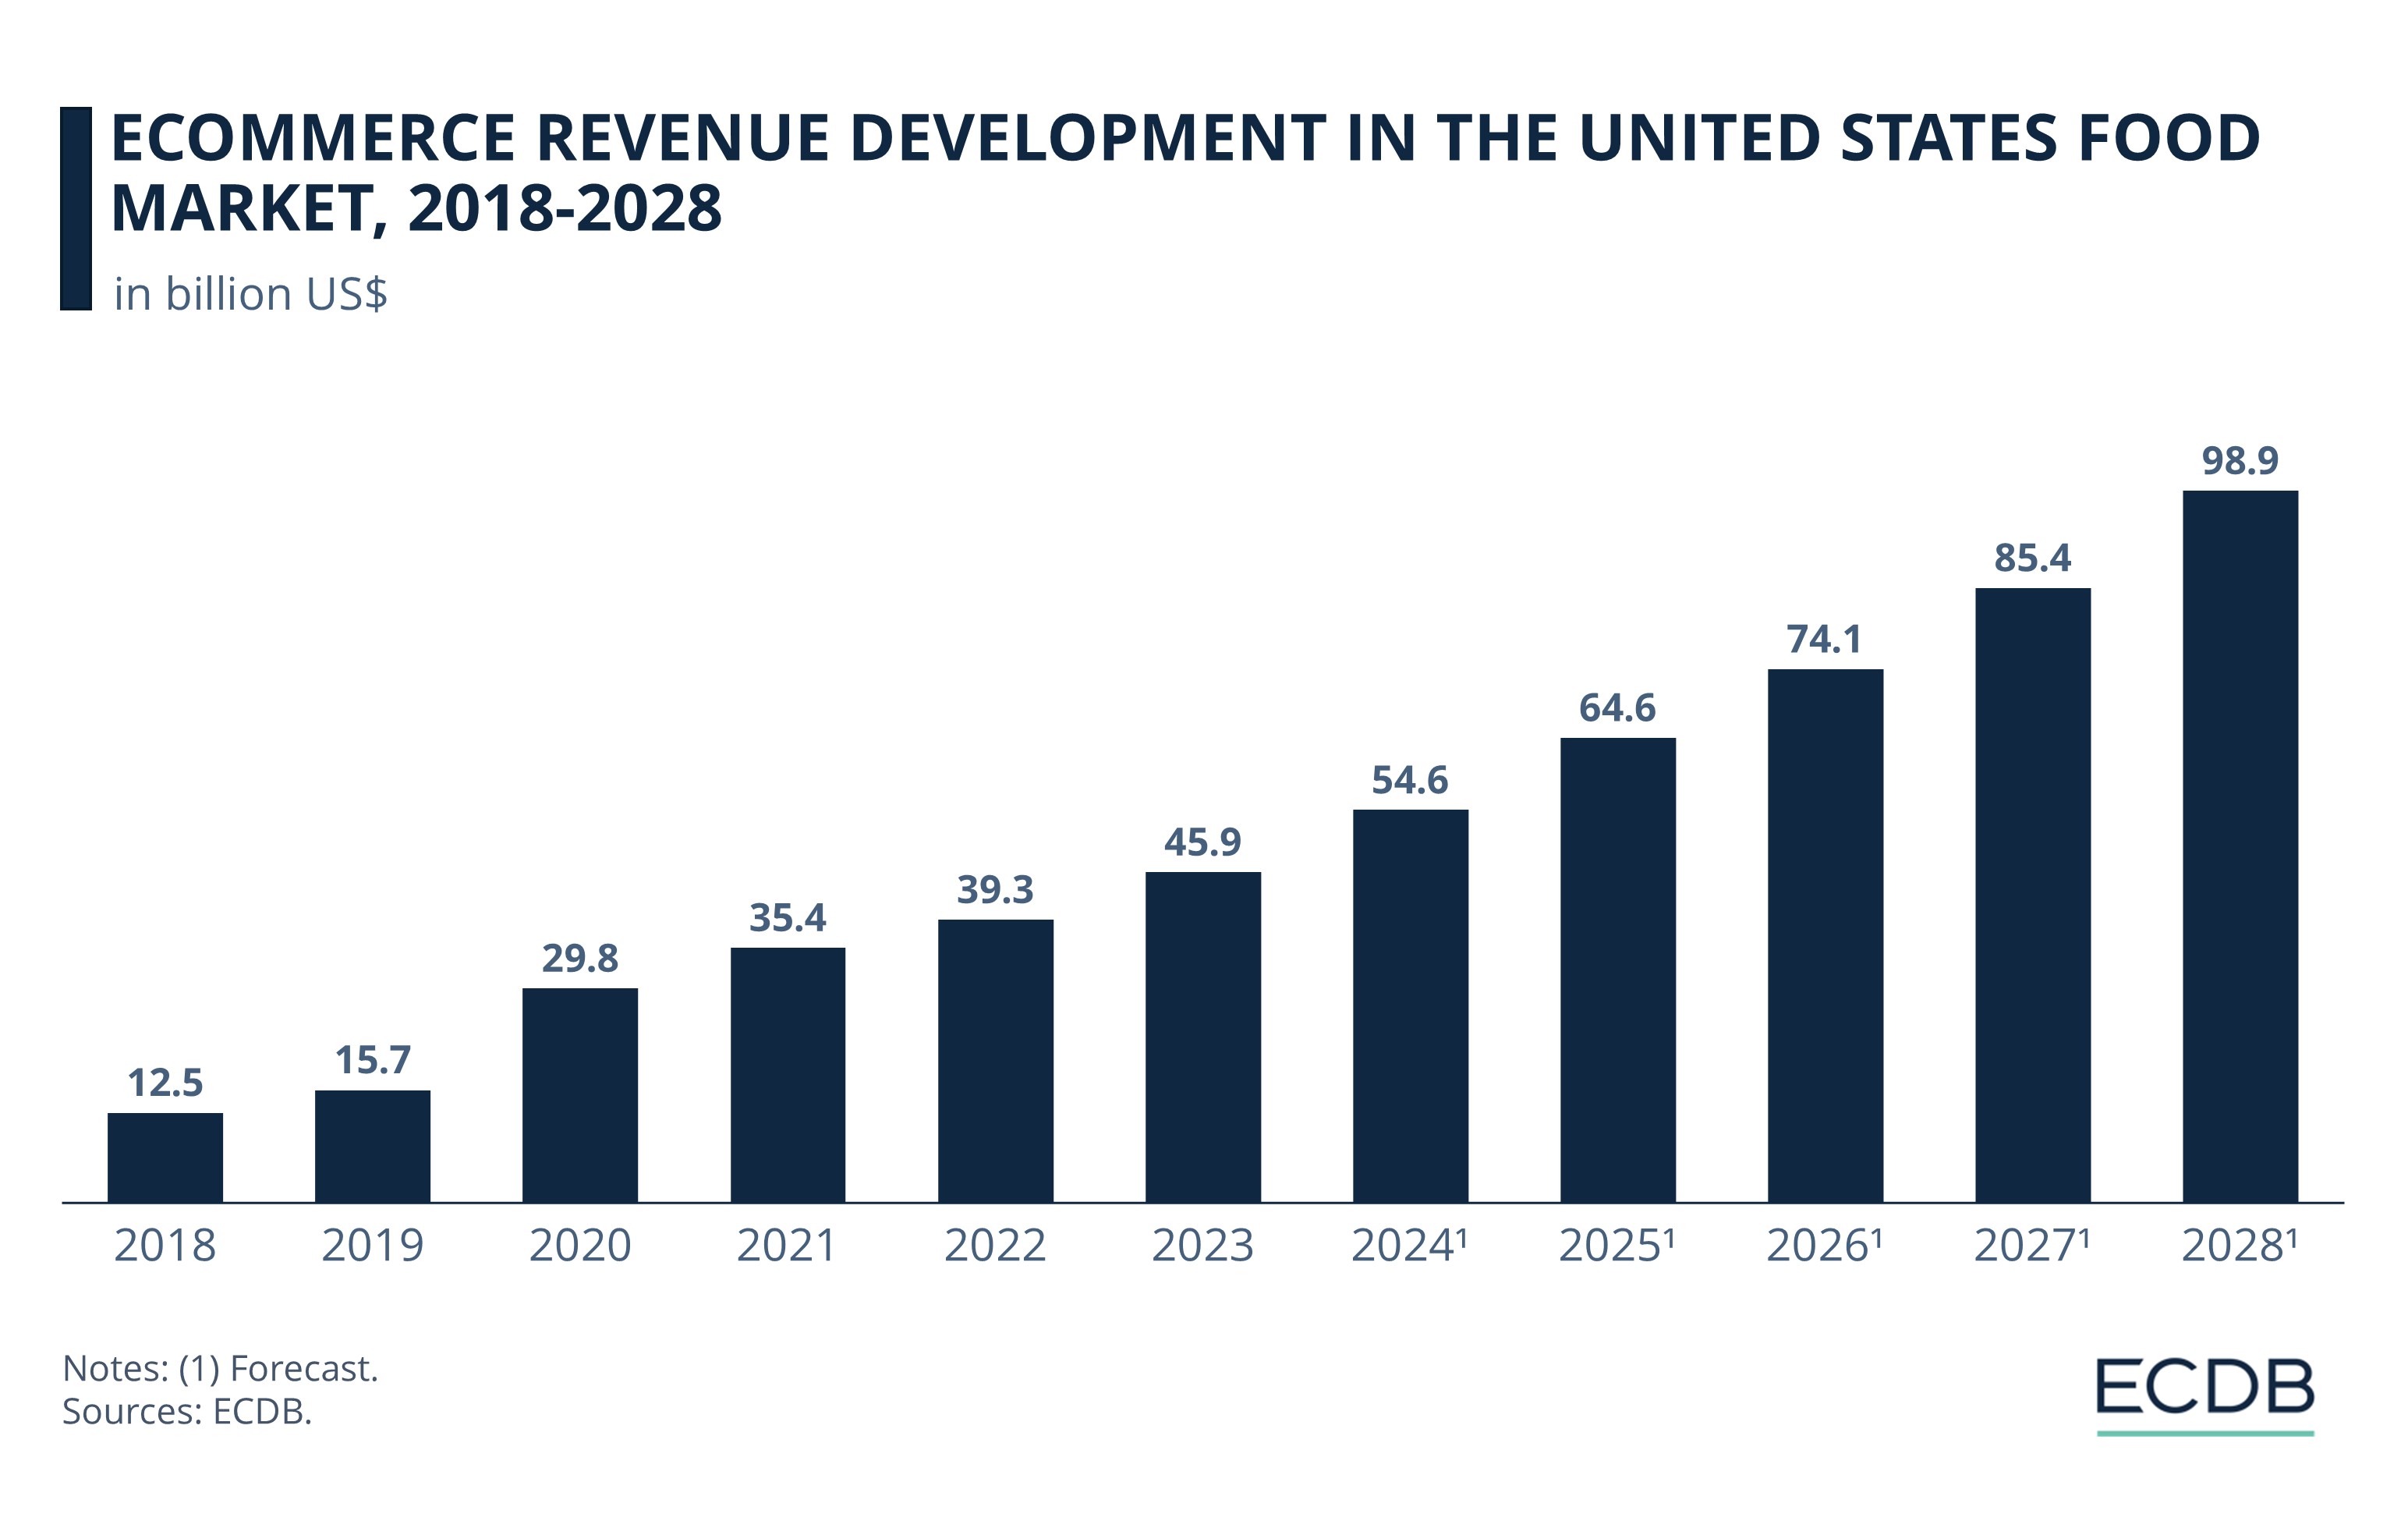
As in many markets, the food product category gained a lot of volume during the pandemic. The eCommerce revenue jumped from US$15.7 billion in 2019 to US$29.8 billion in 2020, corresponding to a YoY growth rate of 90%.
The annual growth rate has slowed but remains above 10%. Similarly, in 2023, with revenues of US$45.9 billion.
ECDB analysts forecast that the food category in the United States will surpass US$50 billion by 2024. Moreover, it is predicted to continue growing at a CAGR of 16% from 2024 to 2028.
Among the top online stores in this U.S. eCommerce market, walmart.com leads with a revenue of US$4.5 billion in 2023. It is followed by hellofresh.com with US$3.5 billion in revenue in 2023 and amazon.com with US$2.4 billion.

2. Pet Supplies (14.3%)
The eCommerce industry is not only about shopping for human beings, but also for their best friends, be they cats, dogs, ducks or other animals. The pet supplies category in the United States saw the second-highest increase in sales last year. That includes sales of products such as treats, toys, aquariums, clothing, and pet pharmaceuticals.
The pet supplies market has been growing for some time, thanks in part to the convenience of online shopping, the growing number of pet owners in the United States and the impact of the pet supplies pandemic:
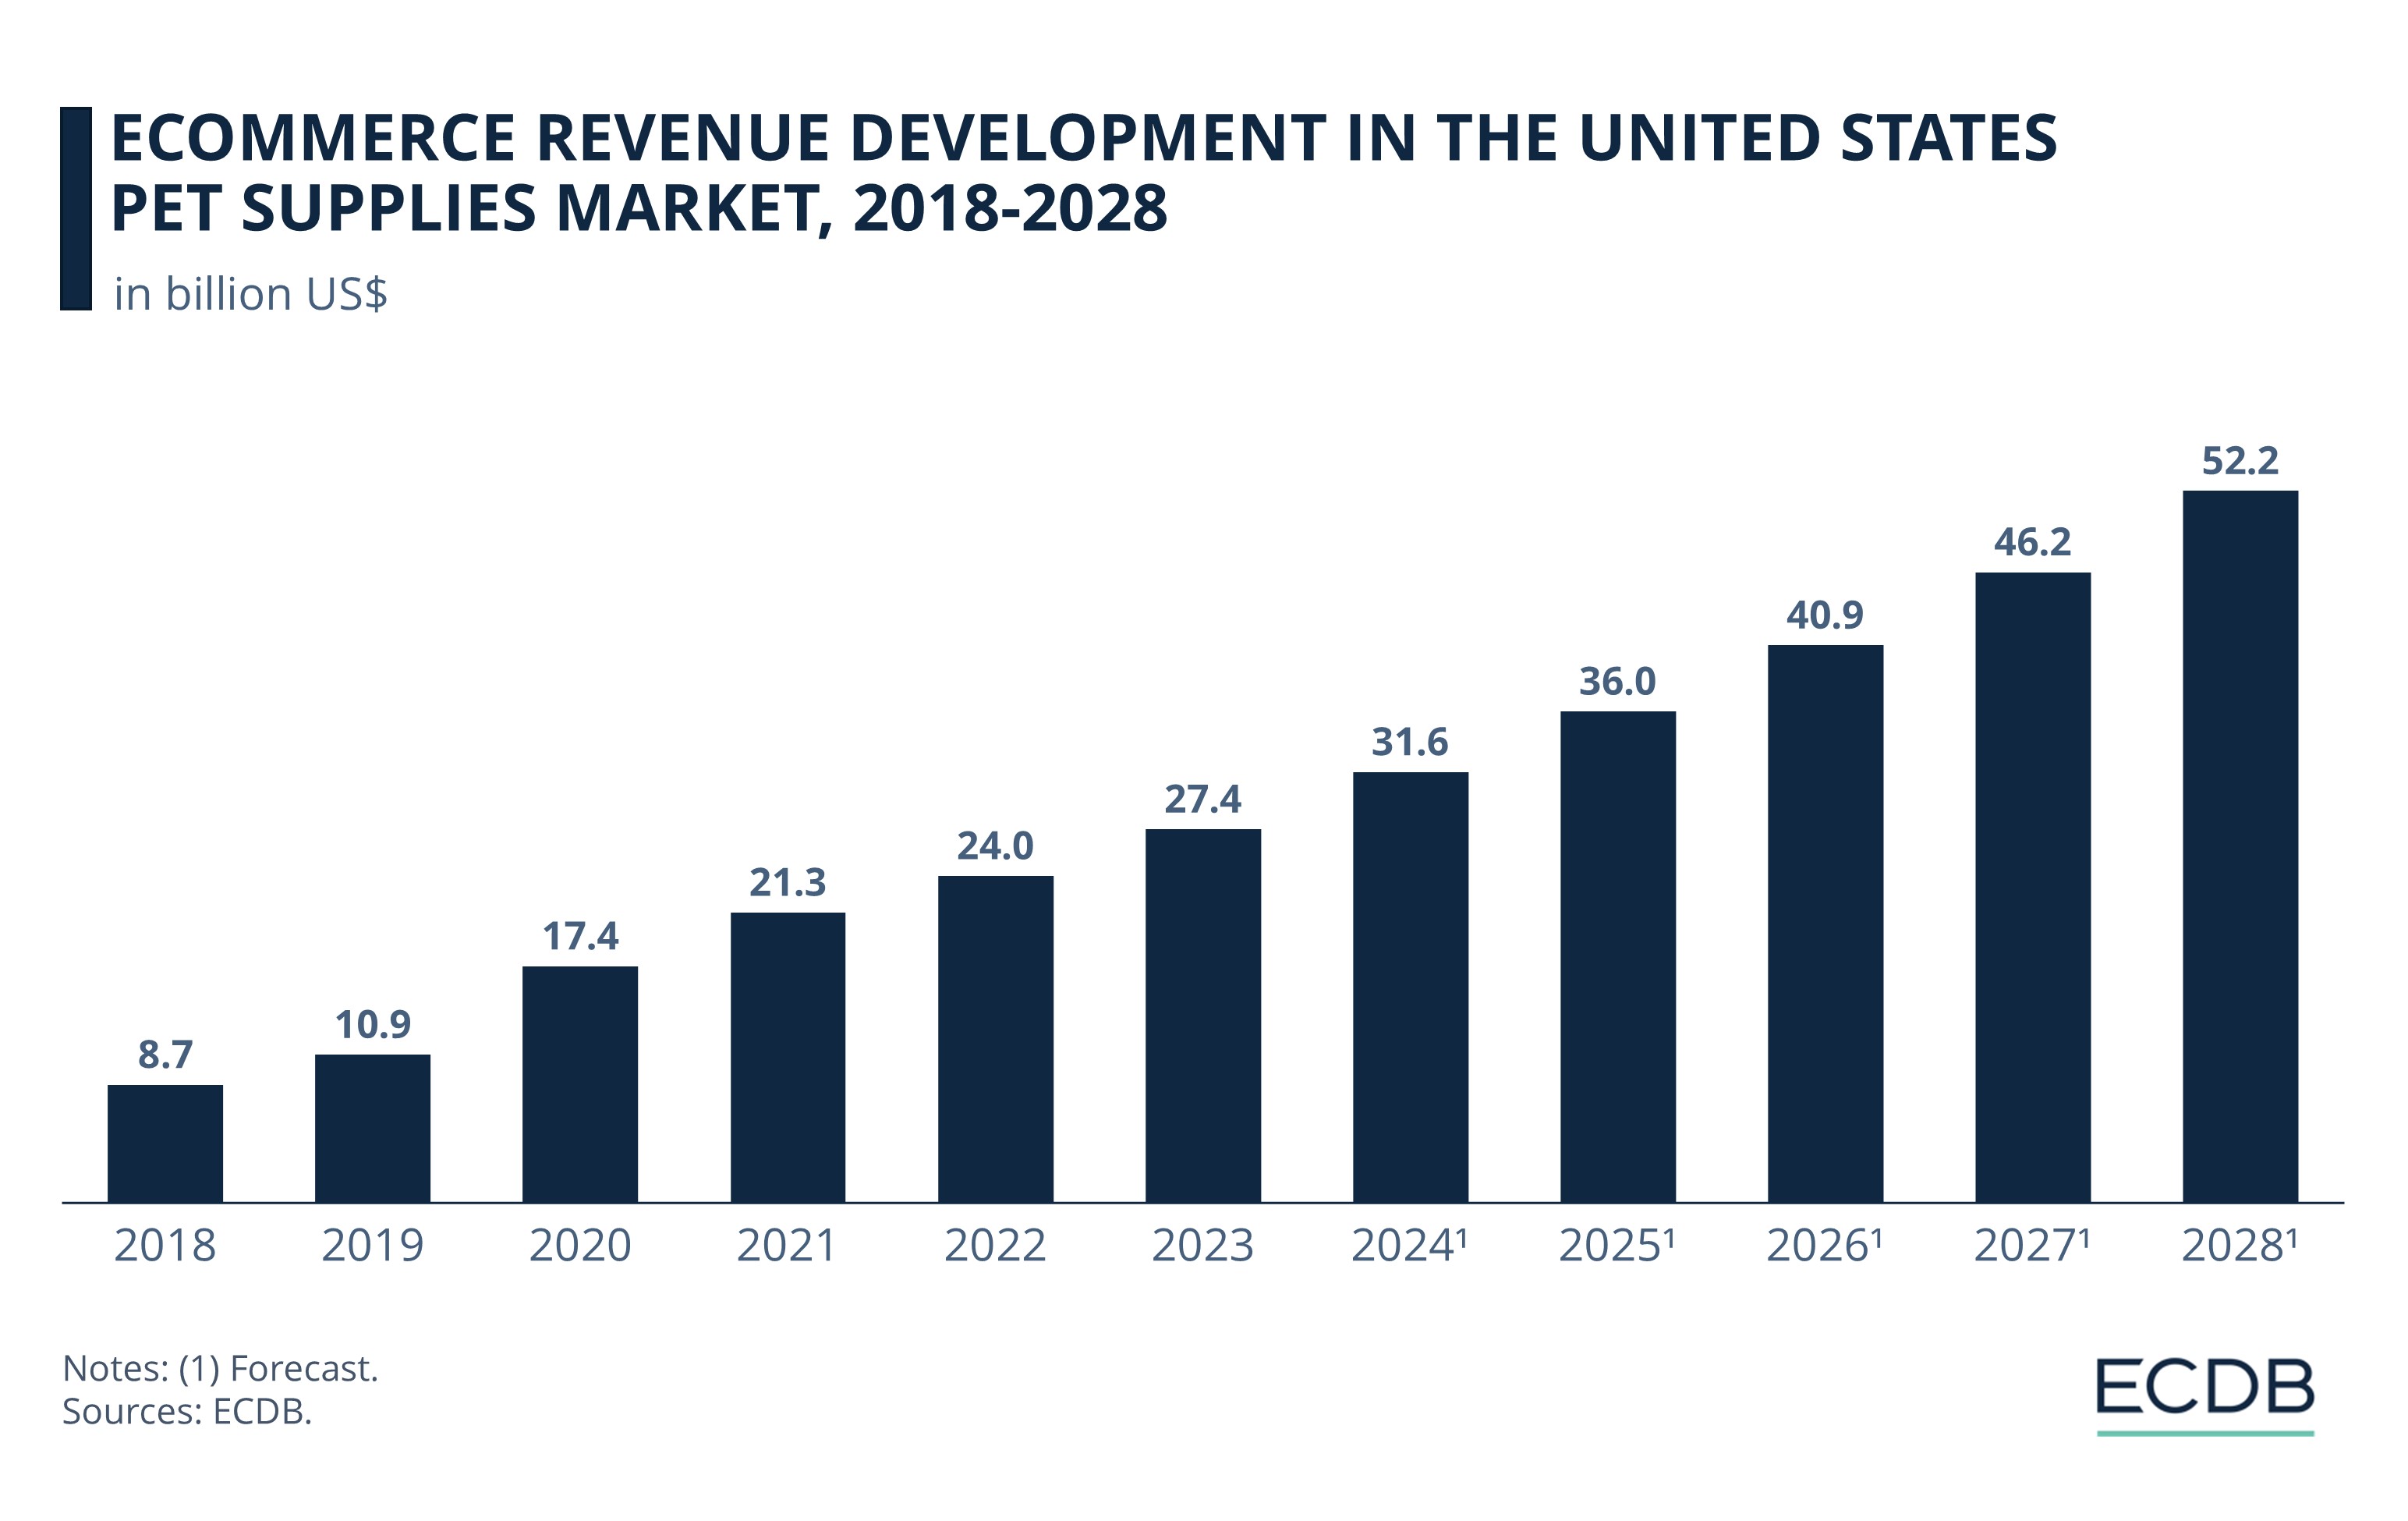
In the past, a significant growth can be observed in 2020, with revenues soaring from US$10.9 billion in 2019 to US$17.4 billion, an increase of almost 60%.
Compared to the surge in 2019, the annual growth rate has declined. Last year, the pet supplies market grew from US$24 billion to US$27.4 billion, an uptick of 14.3%.
In the upcoming years, the eCommerce sector is expected to continue growing at a CAGR of 13.4% (2024-2028). By 2028, the pet supplies market in the U.S. might reach a revenue of US$52 billion.
Looking at the top 5 online pet stores in the United States, one online store in particular stands out: chewy.com. The online store generated US$11 billion in revenue in 2023. Petsmart.com comes in second with US$1 billion, a mere 9% behind chewy.com.

3. Garden (11.5%)
Sales in the garden category are particularly strong in the United States. This is partly due to the diversity of inspiration on the Internet, which is much greater online than in offline stores. In addition, online shopping makes it easy to go from inspiration to purchase in a single click.
Aside from products such as plants, seeds and gardening accessories, barbecue products also fall into this eCommerce category. In fact, barbecues account for over 58.9% of the U.S. garden category, making it one of the main drivers of this eCommerce market:
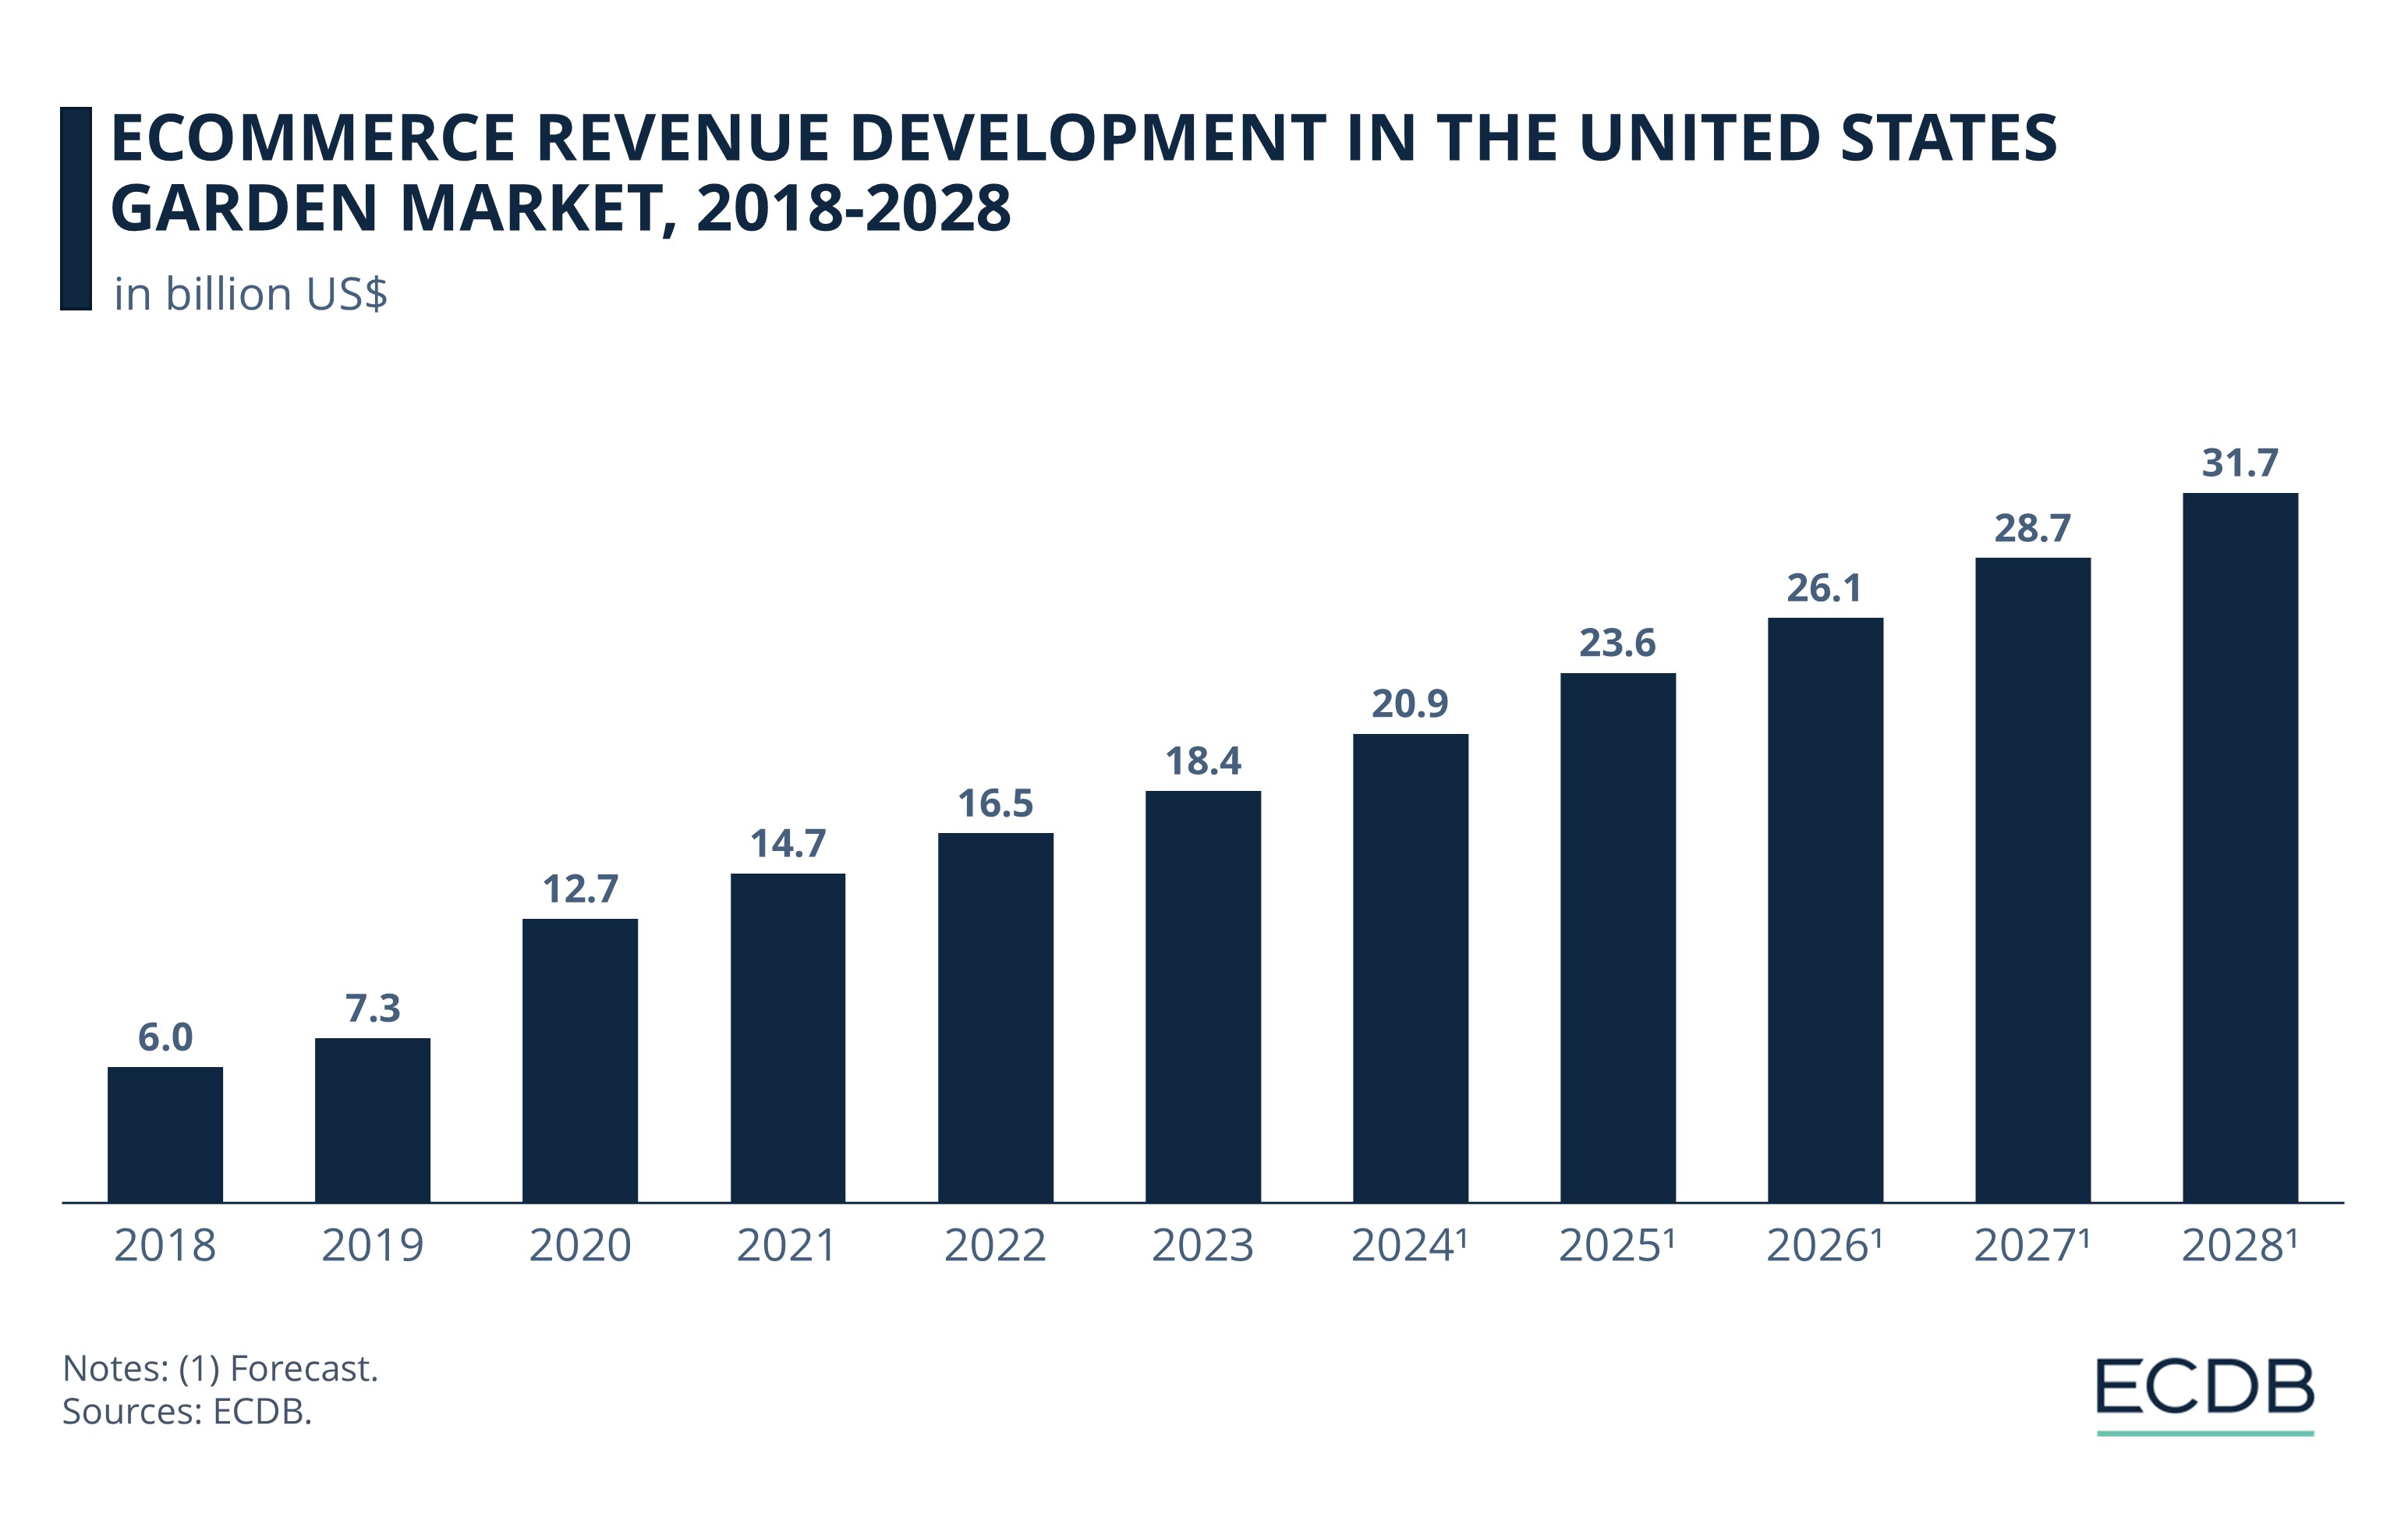
The market saw the biggest increase between 2019 and 2020, with revenues of US$7.3 billion and US$12.7 billion, respectively. Thanks to the pandemic, the garden eCommerce market climbed by 72%.
The product category hasn't seen that kind of growth since, but still manages to stay above 10%. Last year, it rose from US$16.5 billion to US$18.4 billion, an annual gain of 11.5%.
This year, the garden market is predicted to reach US$20.9 billion in revenue. Meanwhile, the growth trend is forecast to sustain at a CAGR of 10.9% from 2024 to 2028.
Behind this are well-known online stores, led by walmart.com, which generated revenues of US$1.9 billion in 2023. The second-largest online retailer is amazon.com, with revenues of US$1.1 billion, closely followed by bestbuy.com with US$1 billion.
4. Personal Care (9.1%)
TikTok and Instagram have pushed in recent years the attention on personal care with trends like the glass skin or trending products like retinol or pimple patches. A lot of those trends thereby come from the Asian region, in particular Korea and Japan.
By linking trending products of the personal care category on social media, shoppers are given the opportunity to easily purchase these products online. These include bath and body products, cosmetics, hygiene products and fragrances.
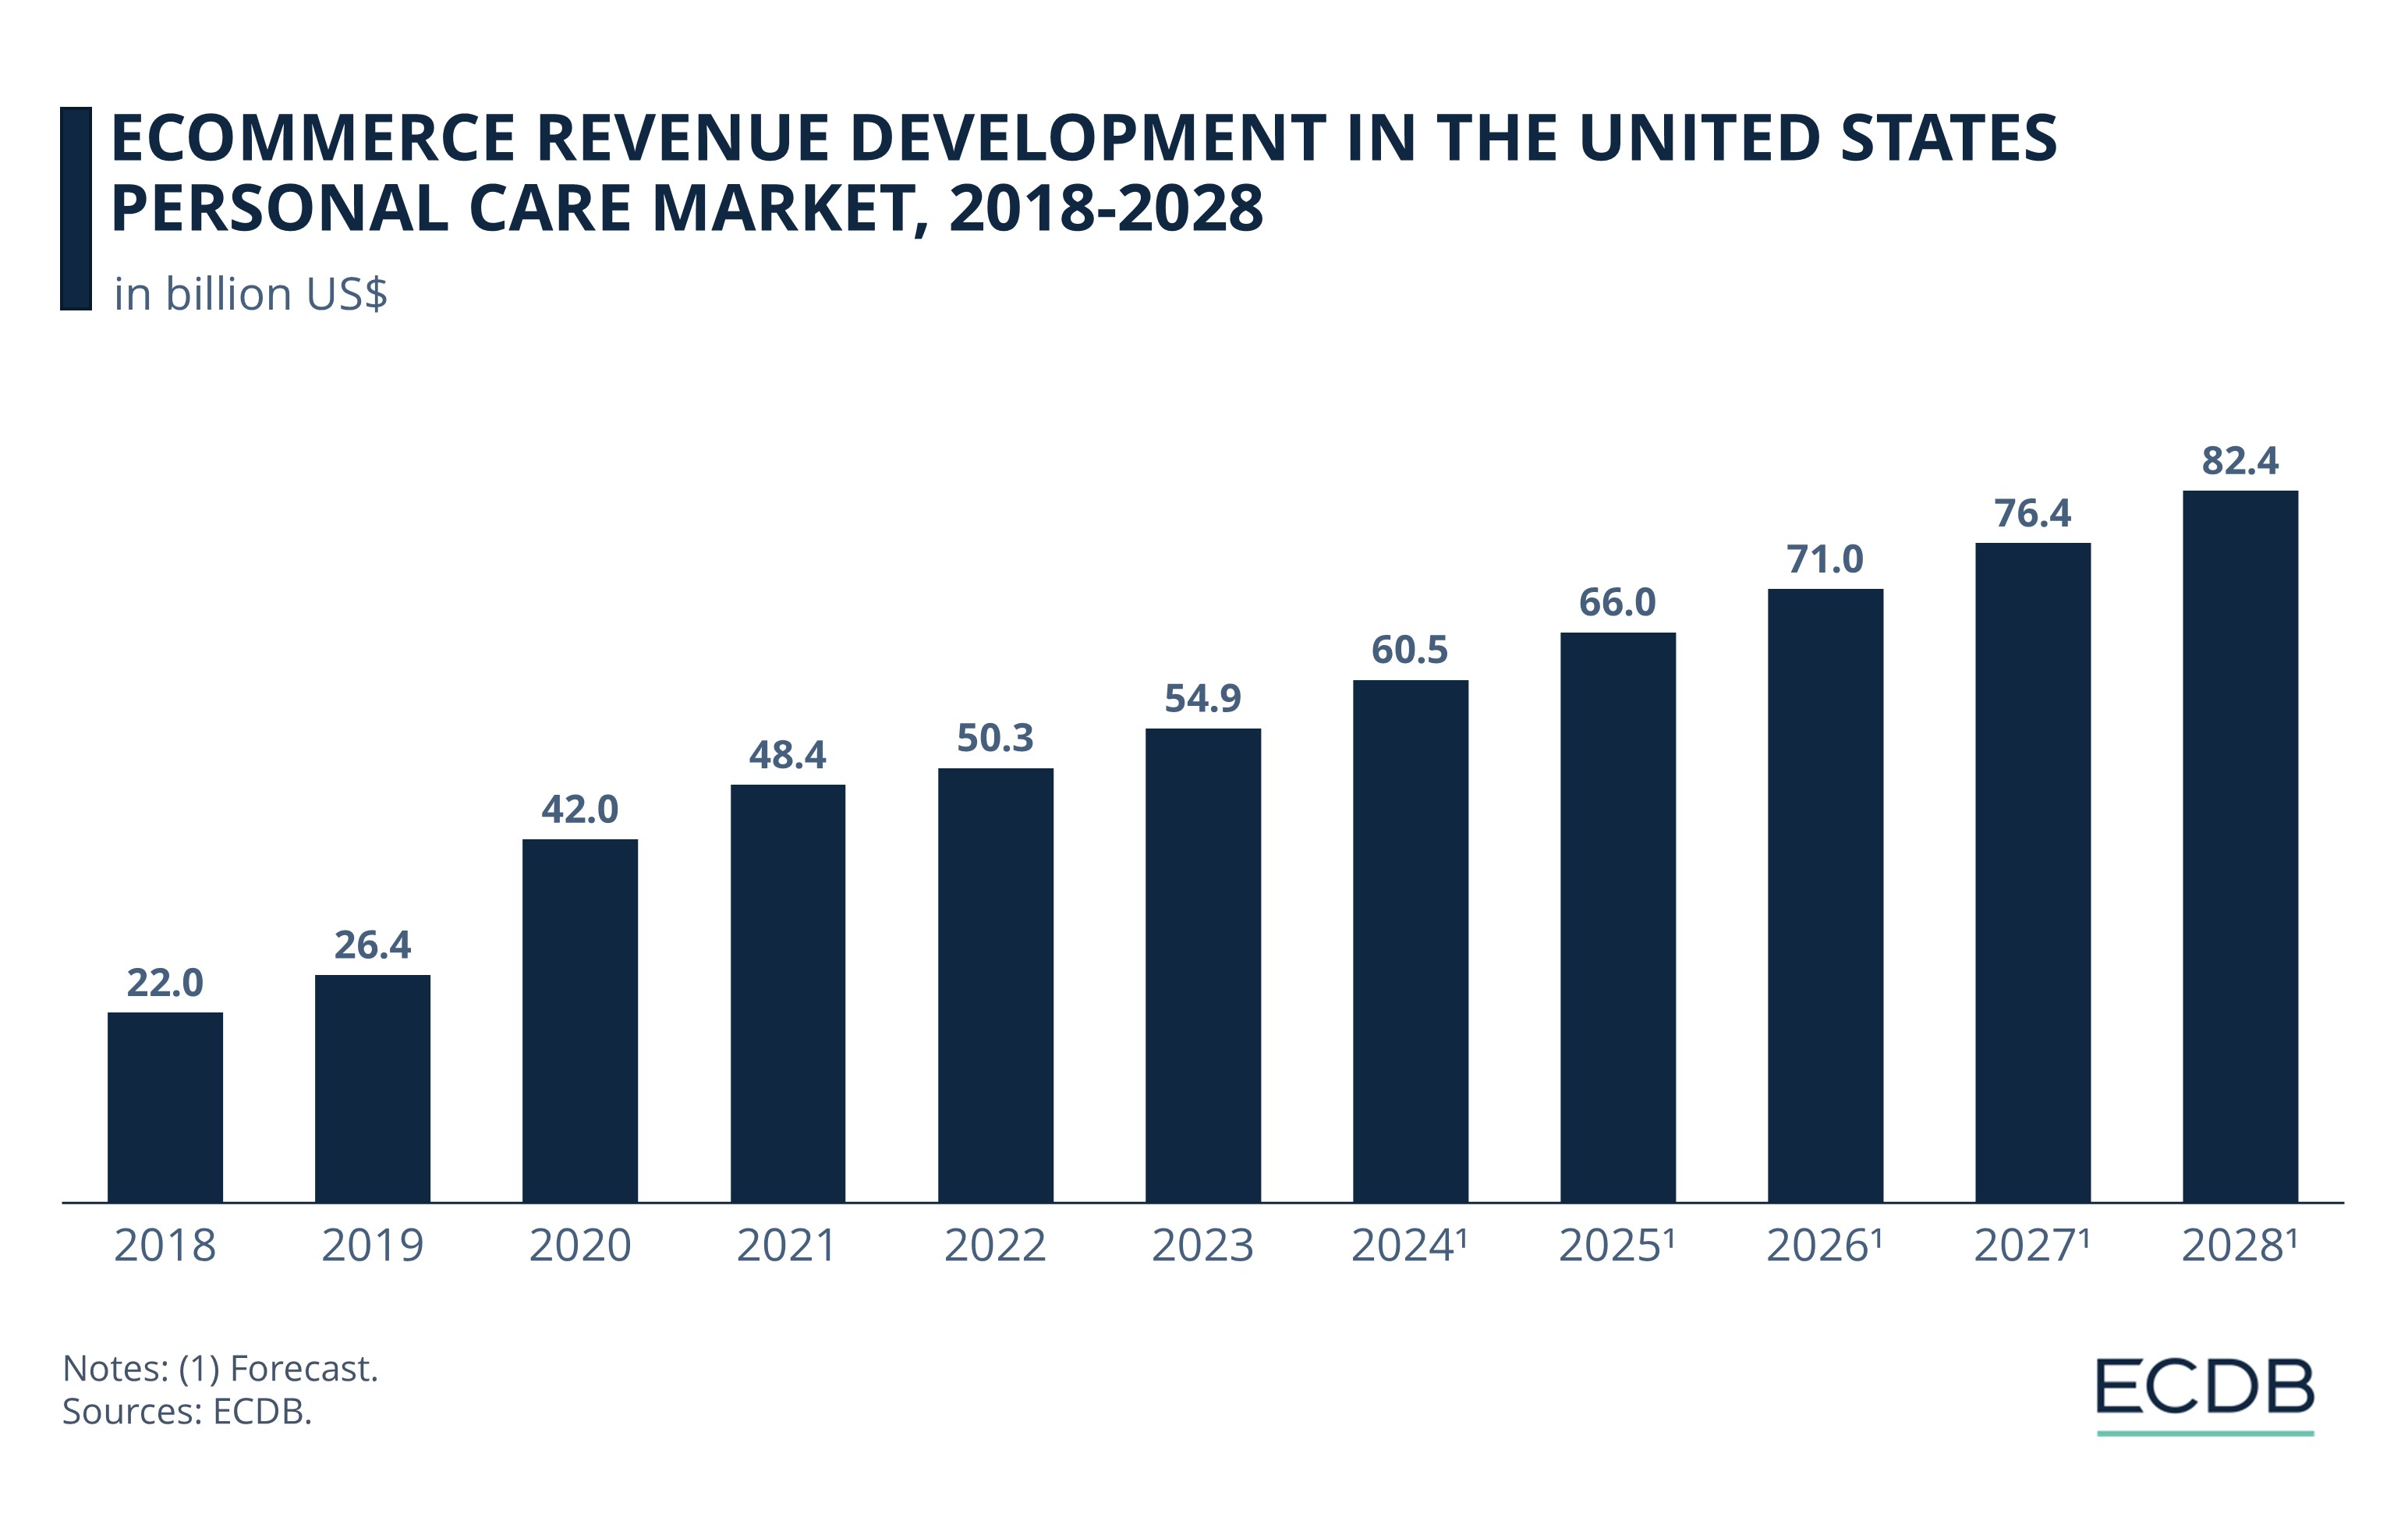
At the beginning of COVID-19, the personal care market in the United States experienced a large boost from US$26.4 billion in 2019 to US$42 billion in 2020, a jump of almost 60%.
In the following years, the eCommerce sector kept growing, but at a slower annual growth rate. From 2022 to 2023, personal care rose from US$50.3 billion to US$54.9 billion, an increase of 9.1%.
According to ECDB analysts, the U.S. personal care market will continue to climb at a CAGR of 8% (2024-2028). By 2028, the market is estimated to reach US$82 billion in revenue.
Behind the growth trend in the market are online stores such as walmart.com and amazon.com, which generated revenues of US$5.1 billion and US$4.3 billion in 2023, respectively. Beauty retailer sephora.com is the third-largest online store, with sales of US$2.7 billion.
Valuable Insights: Our data-driven rankings are regularly refreshed to provide you with crucial insights for your business. Find out which stores and companies are performing will in the eCommerce space and which categories are topping the sales charts. Stay ahead of the market with our rankings for companies, stores, and marketplaces.
5. Household Care (8.9%)
In the United States, the household care eCommerce category was the fifth-fastest growing category last year. The product category includes detergents such as dishwashing, cleaning and laundry detergents, as well as cleaning equipment including brooms, cloths and sponges.
Household care has been on a positive trend for some time:
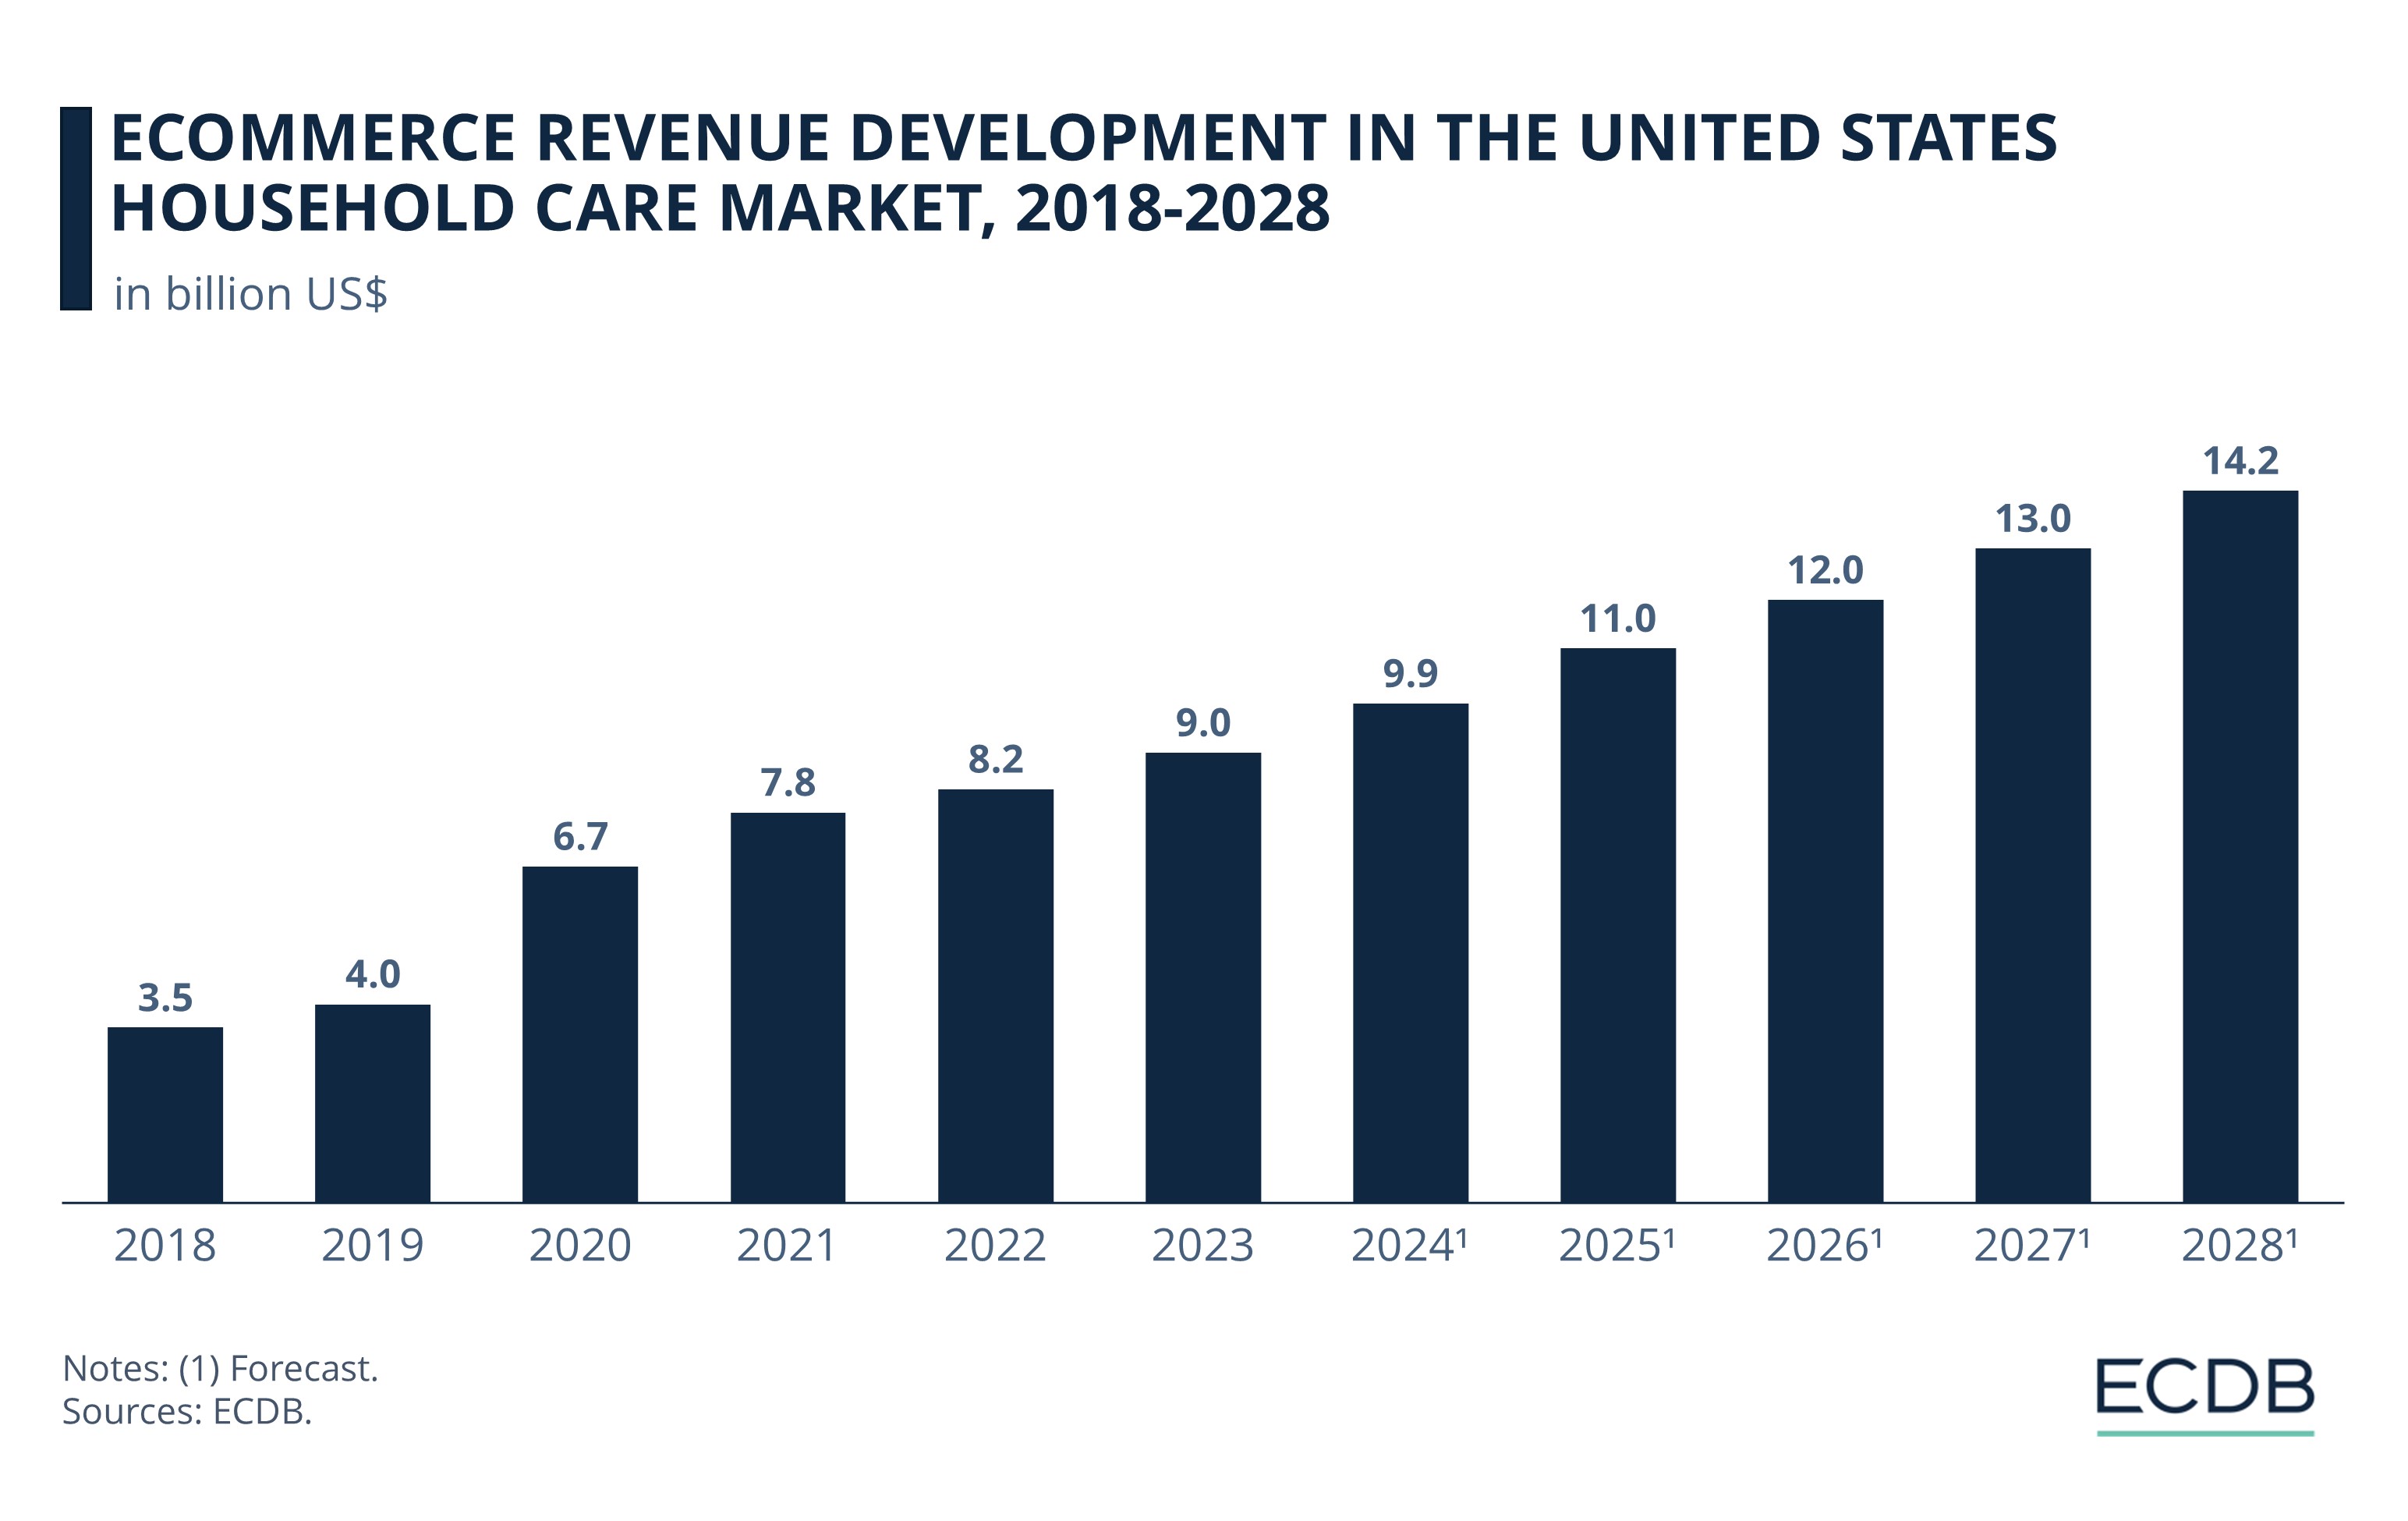
In particular, the category benefited from the eCommerce boom during COVID-19. The revenue jumped from US$4 billion in 2019 to US$6.7 billion in 2020 – an increase of 70%.
After the strong surge, annual growth slowed but remained positive.
For 2024, ECDB analysts expect the eCommerce market for household care to reach almost US$10 billion and to grow at a CAGR between 2024-2028 of 9%.
Among the top online stores rank amazon.com with net sales generated in 2023 of US$1.5 billion, followed by homedepot.com with US$969 million. Both are major contributors to the product category's growth trend.

eCommerce in the United States:
Closing Thoughts
The U.S. eCommerce market continues to grow, with product categories such as food, pet supplies and gardening showing significant upward development. The industry benefited from the pandemic and the restrictions that led to a sudden surge in online shopping.
Despite the fact that the pandemic is over, and offline shopping is back, eCommerce markets in the United States continue to thrive. Contributing to this trend are the convenience of online shopping, as well as trending products and live commerce on social media platforms such as TikTok or Instagram.
The world of online and offline shopping is expected to become more balanced in the coming years. In addition, the combination of brick-and-mortar stores with online shopping features, may become more common.
Sources: ECDB, secondary sources in the referenced articles.
Click here for
more relevant insights from
our partner Mastercard.
Related insights
Deep Dive
Jumia Business Analysis: Top Markets, Revenue, GMV & eCommerce in Africa
Jumia Business Analysis: Top Markets, Revenue, GMV & eCommerce in Africa
Deep Dive
Largest Product Categories in German eCommerce: Fashion Tops the List
Largest Product Categories in German eCommerce: Fashion Tops the List
Deep Dive
Trends in German eCommerce: Germans Like What They Know
Trends in German eCommerce: Germans Like What They Know
Deep Dive
Walmart Expands Pet Care Services
Walmart Expands Pet Care Services
Deep Dive
Monthly eCommerce Market Revenue Growth: Online Retail Sales (September 2024)
Monthly eCommerce Market Revenue Growth: Online Retail Sales (September 2024)
Back to main topics