How to Analyze eCommerce Growth
Why Are eCommerce Companies Growing?
Total revenues, eCommerce activity, product categories: ECDB shows what drives eCommerce growth. We tell you how to use this data.
Article by Nikolai Surminski | July 08, 2024Download
Coming soon
Share

Why eCommerce Companies Are Growing: Key Insights
Total Revenues: High total revenues make it harder for companies to maintain steady growth as there are fewer avenues for further expansion. Each additional percentage in revenues decreases revenue growth by 0.05 percentage points.
eCommerce Activity: Strong market growth and the continuous shift towards market business are the reasons that companies can still rely on eCommerce activity for growth. A 1% increase in eCommerce activity leads to 0.05 percentage points of additional growth.
Product Categories: Companies with a focus on Grocery are growing much faster due to high market growth and untapped market potential. In contrast, companies with a strong electronics business are held back by a mature market diminishing future growth.
America vs. Europe: American companies are growing much faster than their European competitors, as each additional percentage point of revenues generated in the Americas increases the average growth rate by 0.05 percentage points.
Recent years have been a boon for global eCommerce companies, as the global eCommerce market is home to some of the fastest-growing companies in the world.
Retailers such as Sea, Ltd. (96.9%) and PDD Holdings, Inc. (77.4%) have experienced enormous annual average growth rates since 2018 driven by continuous shifts to digital retail.
But what makes some companies grow faster than others? We show you why some eCommerce companies are growing rapidly while others are stagnating. These are the most important factors in determining your future growth.
eCommerce Is Growing by More Than 10% in 2024
Growth in the eCommerce market has been impressive in recent years. The global eCommerce market has grown with an average annual rate of 16.2% since 2018.
Global economic output has grown by just 3.8% per year, showcasing the role of eCommerce as a growth industry across the globe.
These growth rates are far above even the biggest growth markets, as only two countries, Macao and Guyana, have shown higher growth than the eCommerce industry in recent years.
Some segments of the overall eCommerce market have grown at an even higher rate, with Grocery reaching a CAGR of 21.6% between 2018 and 2023.
Growth rates have been on a slight upward trend in recent years as the market is expected to grow by 10.4% in 2024.
This is a significant step down from growth rates of 31% and 18.5% in 2020 and 2021, respectively, but still almost 2 percentage points above growth in 2022 when post-covid shifts hit the eCommerce industry with outsized effect.
With growth forecast to slow slightly over the next years, our analysis offers exclusive insights into individual growth factors.
Growth Analysis of Hundreds of Companies Over Five Years
Through our unique ECDB database, we analysed the world’s largest eCommerce companies and their growth patterns over the last five years.
We found the key factors that allowed them to grow. All of these results can be interpreted as the direct effect of each specific metric if all other factors are unchanged.
Why Are eCommerce Companies Growing?
What makes eCommerce companies grow? The answer is a mix of different growth factors.
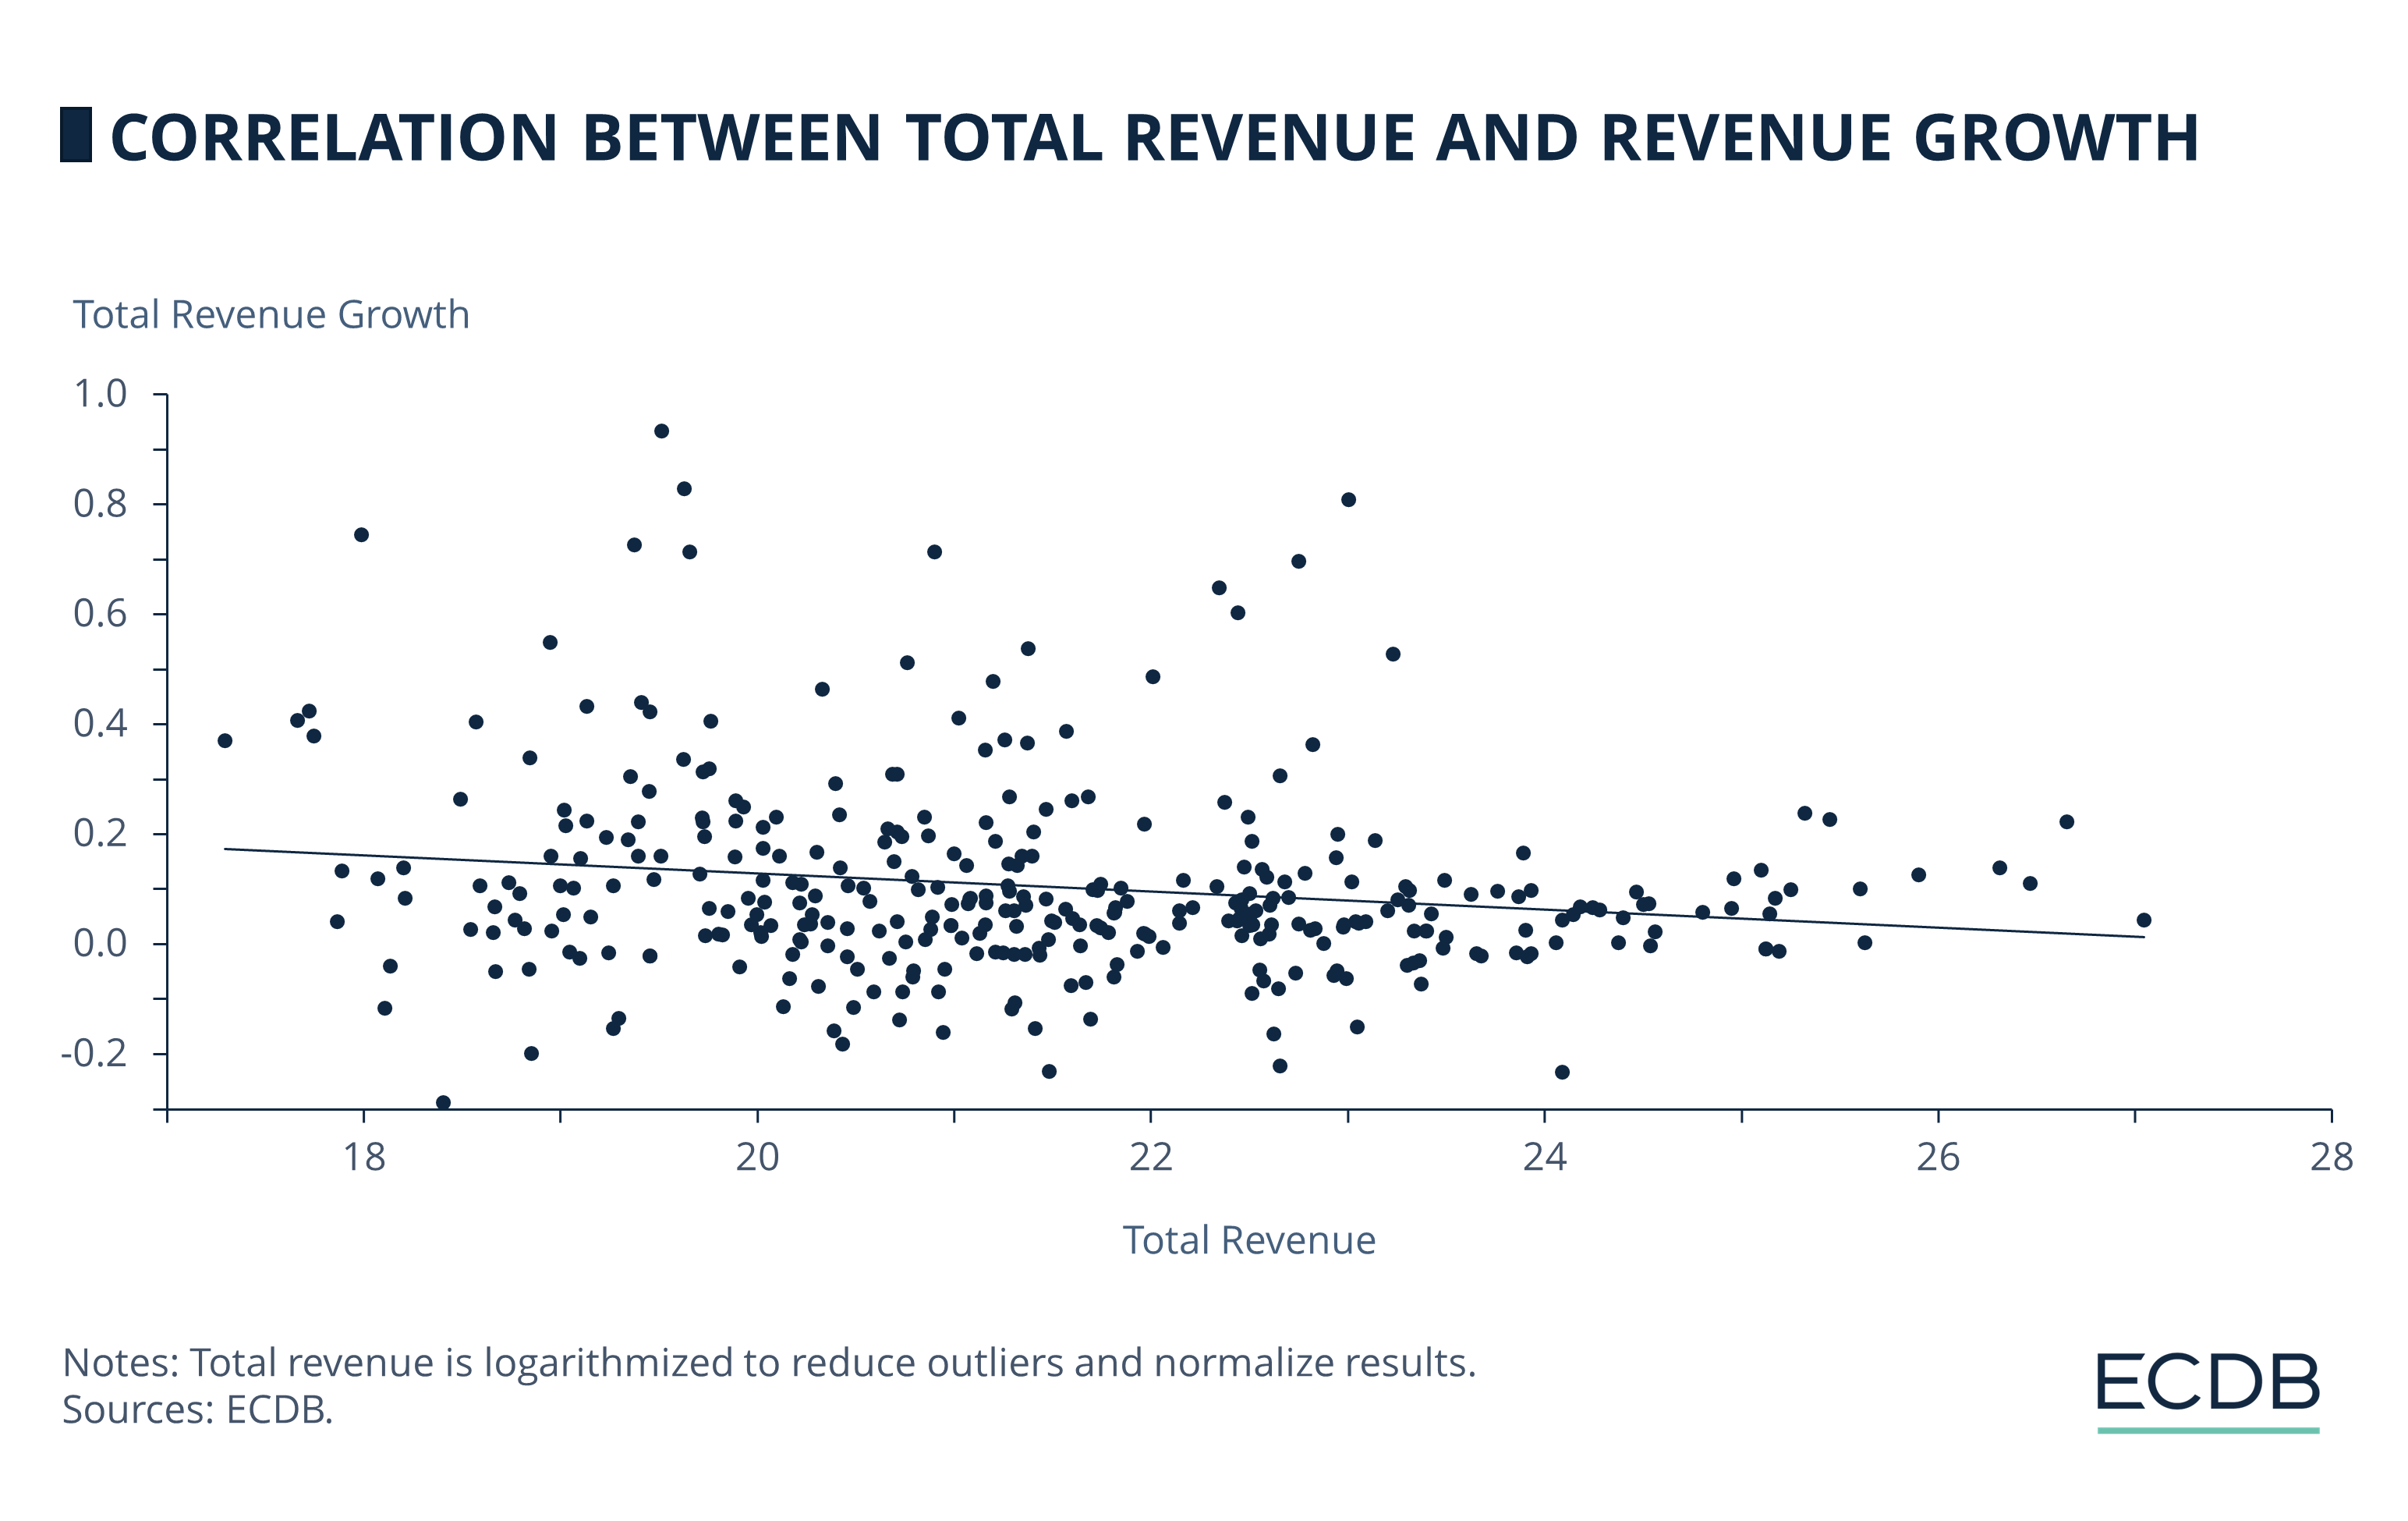
1. Total Revenues:
Total revenues are one of the best indicators for a company’s size. And a company’s size severely limits future growth potential as there are less avenues for easy expansion.
Higher revenues also increase the required additional revenue just to maintain the same level of growth and raise the likelihood that the company conducts a significant share of business in other low-growth business segments.
An additional percentage in revenues decreases revenue growth on average by 0.05 percentage points. Similar to all other factors, this is the average effect if all other metrics are held constant.
To put this seemingly low number into perspective: Walmart’s total revenues are 40 times higher than the revenues of the average company.
In turn, Walmart’s average growth over the last years has been just 4.4% while the average company has grown by 13% per year. This is mostly due to significant activities in fields such as brick-and-mortar retail.
2. eCommerce Activity
eCommerce activity revenue refers to both first-party sales and third-party GMV generated on all online platforms of a company. eCommerce activity is therefore a measure for the size of the eCommerce business.
And digital retail is still a growth market for most retailers showcased by growth rates of the overall market. If a company’s eCommerce activity is just 1% higher, average growth is also about 0.05 percentage points higher.
This trend shows that eCommerce seems to scale more efficiently and can tap into new markets more effectively that traditional sales channels (i.e., total revenue).
In addition, high eCommerce activity can be understood as an indicator for strong marketplace business as the inclusion of third-party GVMV leads to a higher eCommerce share.
As marketplace business tends to be more profitable, a lot of companies have encouraged strong growth in this area. It also explains why Amazon.com, Inc. is growing much faster than Walmart, Inc. despite being of similar size in terms of revenues.
3. eCommerce Share
But it is not just the overall eCommerce activity that impacts growth. Revenue growth is also impacted by a company’s eCommerce share measured as the share of eCommerce activity on total revenue.
An eCommerce share that is 1% higher in the previous year increases revenue growth in the current year by 0.1%.
An increased eCommerce share is an indicator that a company has successfully integrated digital channels, leading to a higher importance of the eCommerce business. And as the data has shown, more eCommerce business also means higher growth.
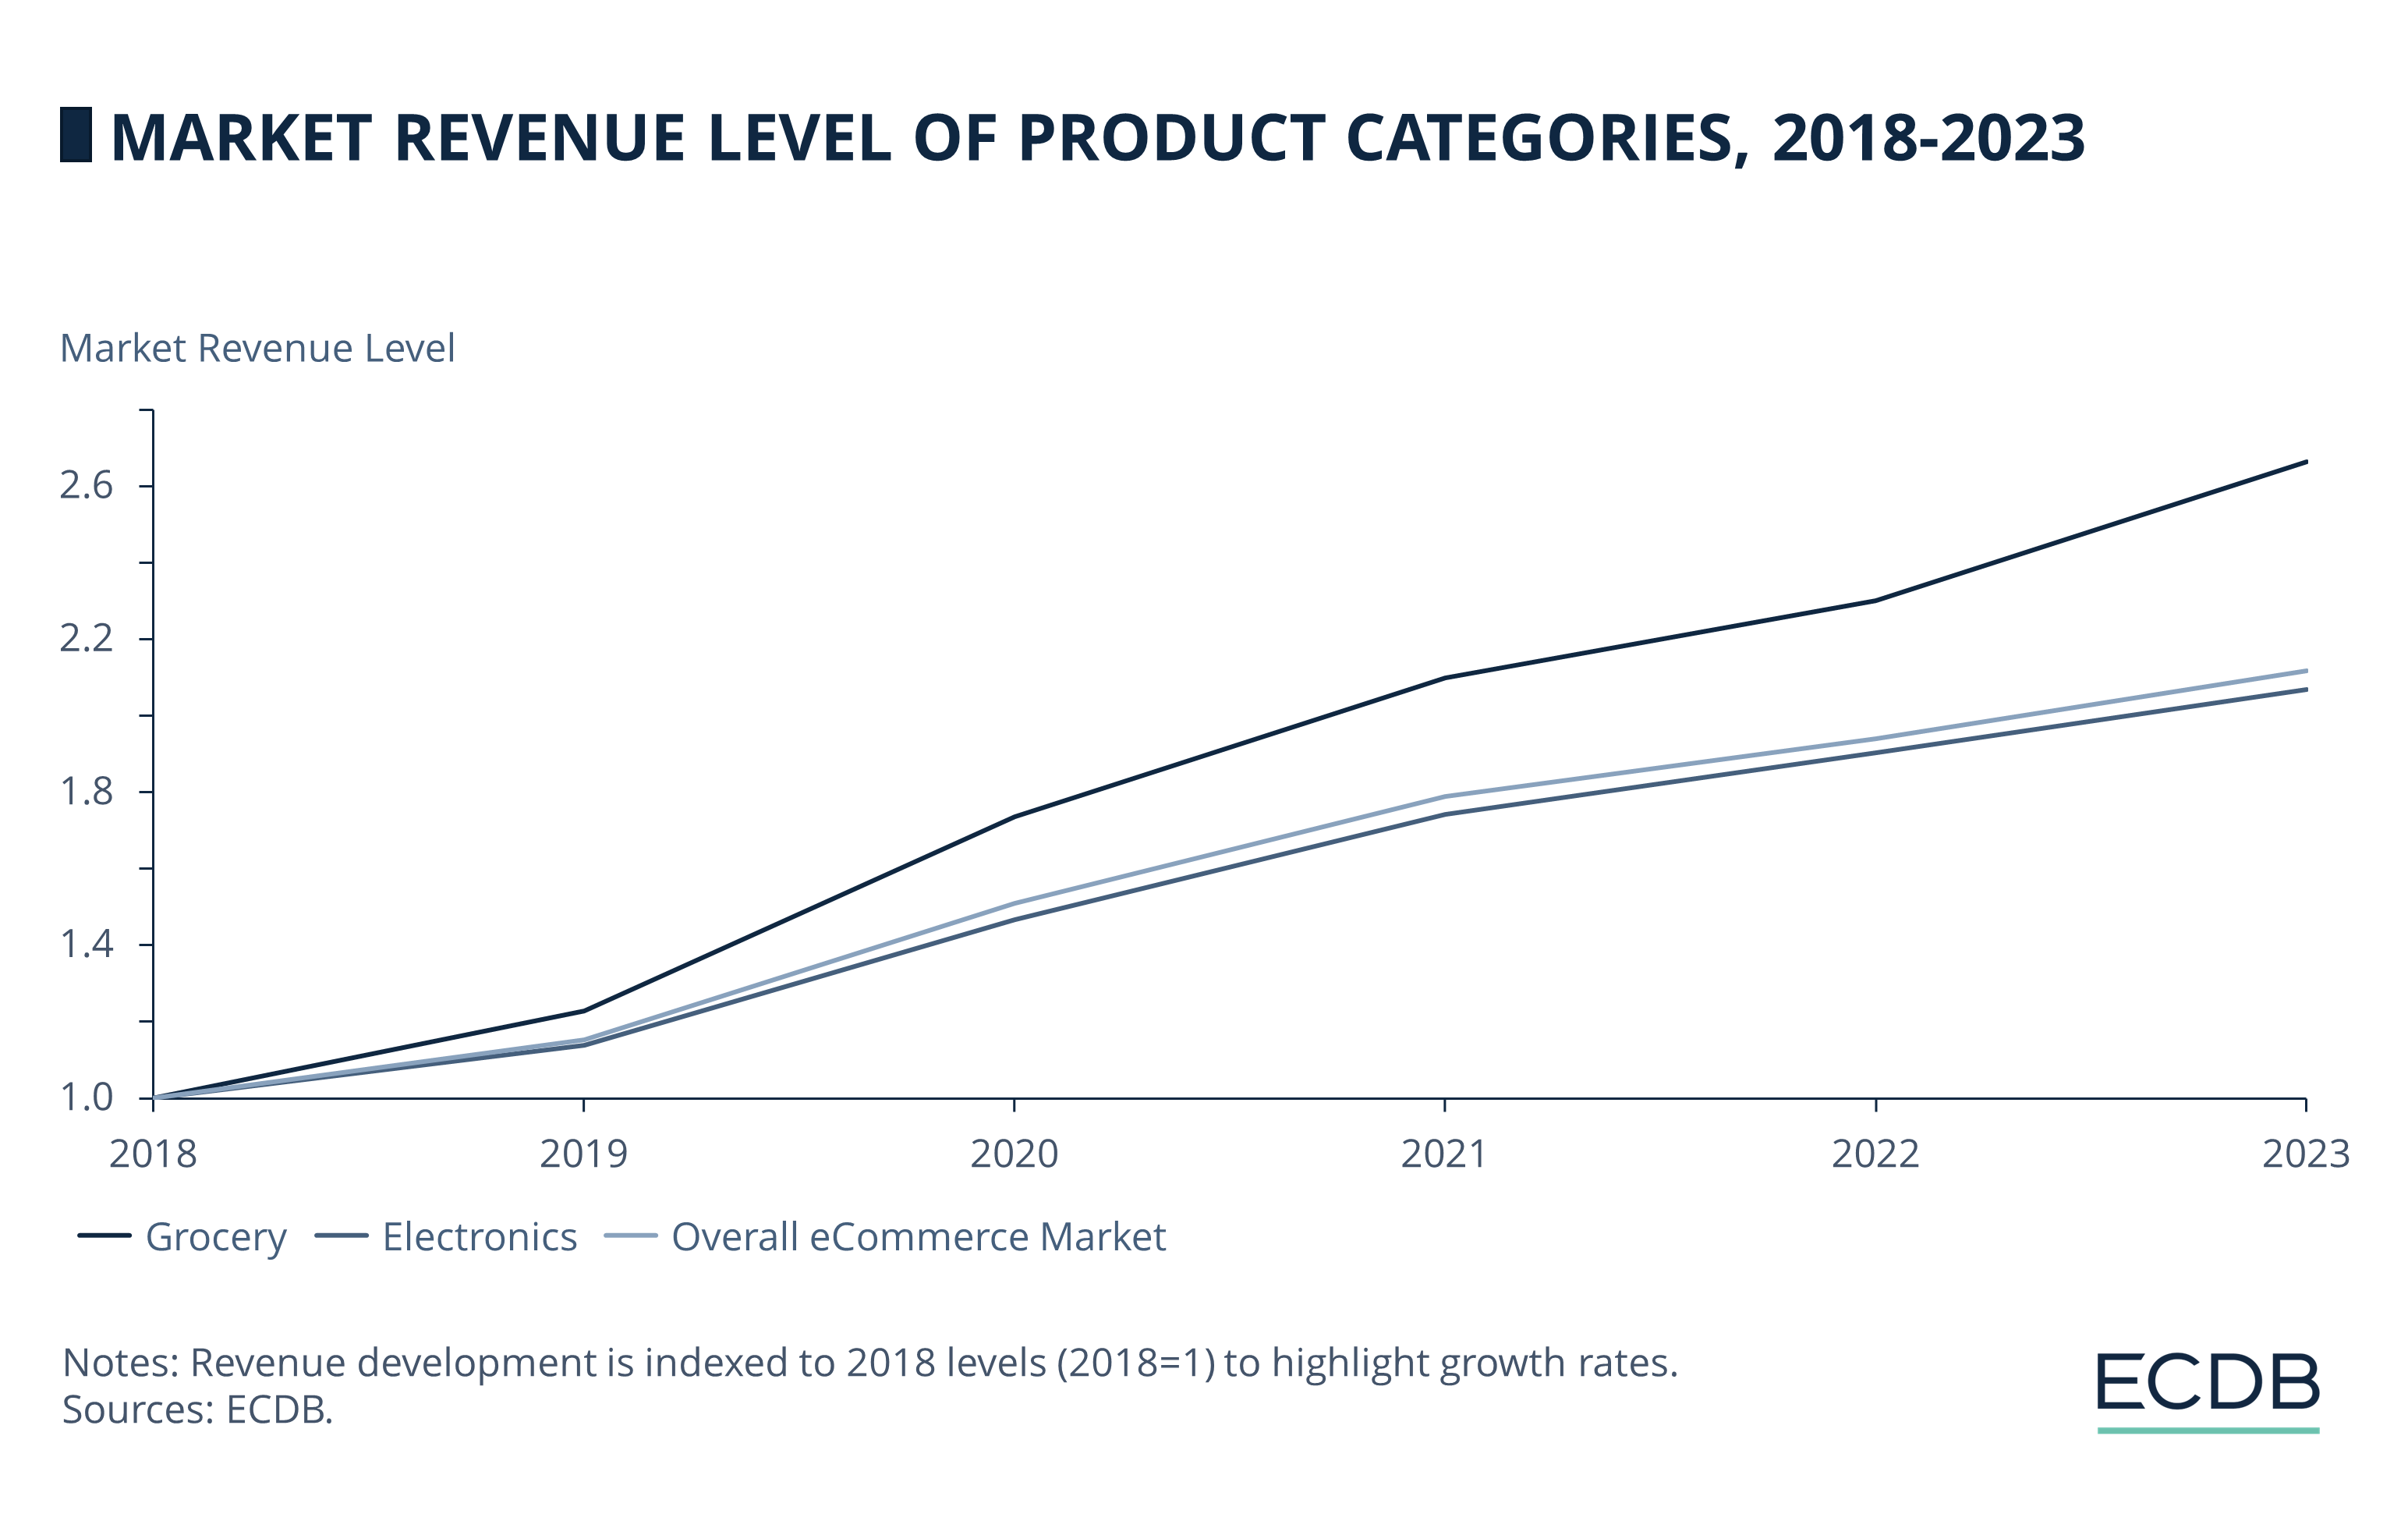
Electronics Companies Are Growing Slower
But it is not just a company’s overall business that impacts growth patterns. Revenue development is also affected by the market segments that a company operates in.
As product categories are growing at a different pace, companies tend to broadly follow this trend.
At the same time, future growth potential is also limited by the overall market revenue. Average revenue growth is therefore dependent on the company’s main category.
1. Electronics
A company mainly operates in the Electronics category if it generates more eCommerce revenues in this category than any other. Examples include Apple, Inc., JD.com, Inc. or Best Buy Co., Inc.
Our data shows that companies with a focus on electronics grow on average 5.4 percentage points slower per year compared to companies with similar characteristics.
This is partially due to the electronics category growing slower than the total eCommerce market (8.6% to 9.2% in 2023).
Electronics is already the second-largest product category, diminishing future growth potential. Electronics retailers are also subject to faster technological changes as well as recent supply chain disruptions, making growth patterns less consistent in recent years.
2. Grocery
Some of the fastest growing eCommerce companies operate in the Grocery category. Retailers such as DoorDash, Inc. or Dingdong, Ltd. have on average grown by more than 100% per year since 2018.
And this is part of a larger trend. Companies that mainly operate in the grocery eCommerce space show a base growth that is on average 9.5 percentage points higher.
This is no surprise, as Grocery is the product category with the highest growth rate by a wide margin. The market has grown by 15.4% in 2023 alone, lifting the tide of all companies.
The COVID-19 pandemic has increased consumer preference for online grocery shopping. And despite high growth, grocery is still a largely untapped eCommerce market that ensures steady demand and high purchase frequency.
3. Additional Subcategories Reduce Growth
Revenue growth is also heavily dependent on the scope of business. Companies that are active in more subcategories also have a lower average growth.
Each additional subcategory that a retailer is active in reduces growth on average by 0.3 percentage points. With an average yearly growth rate of 12.6%, this represents a significant factor in determining revenue trends.
The primary reason for this can be found in the lack of specialization leading to weaker competitive advantage in individual categories.
Entering these markets can require significant investment and operational focus.
As some of these markets might not have the same growth potential or could yield lower returns in the short-term, this can dilute efficiency in existing profitable areas while also increasing threshold to maintain growth.
To achieve a more diversified business model, companies are therefore forgoing additional growth.
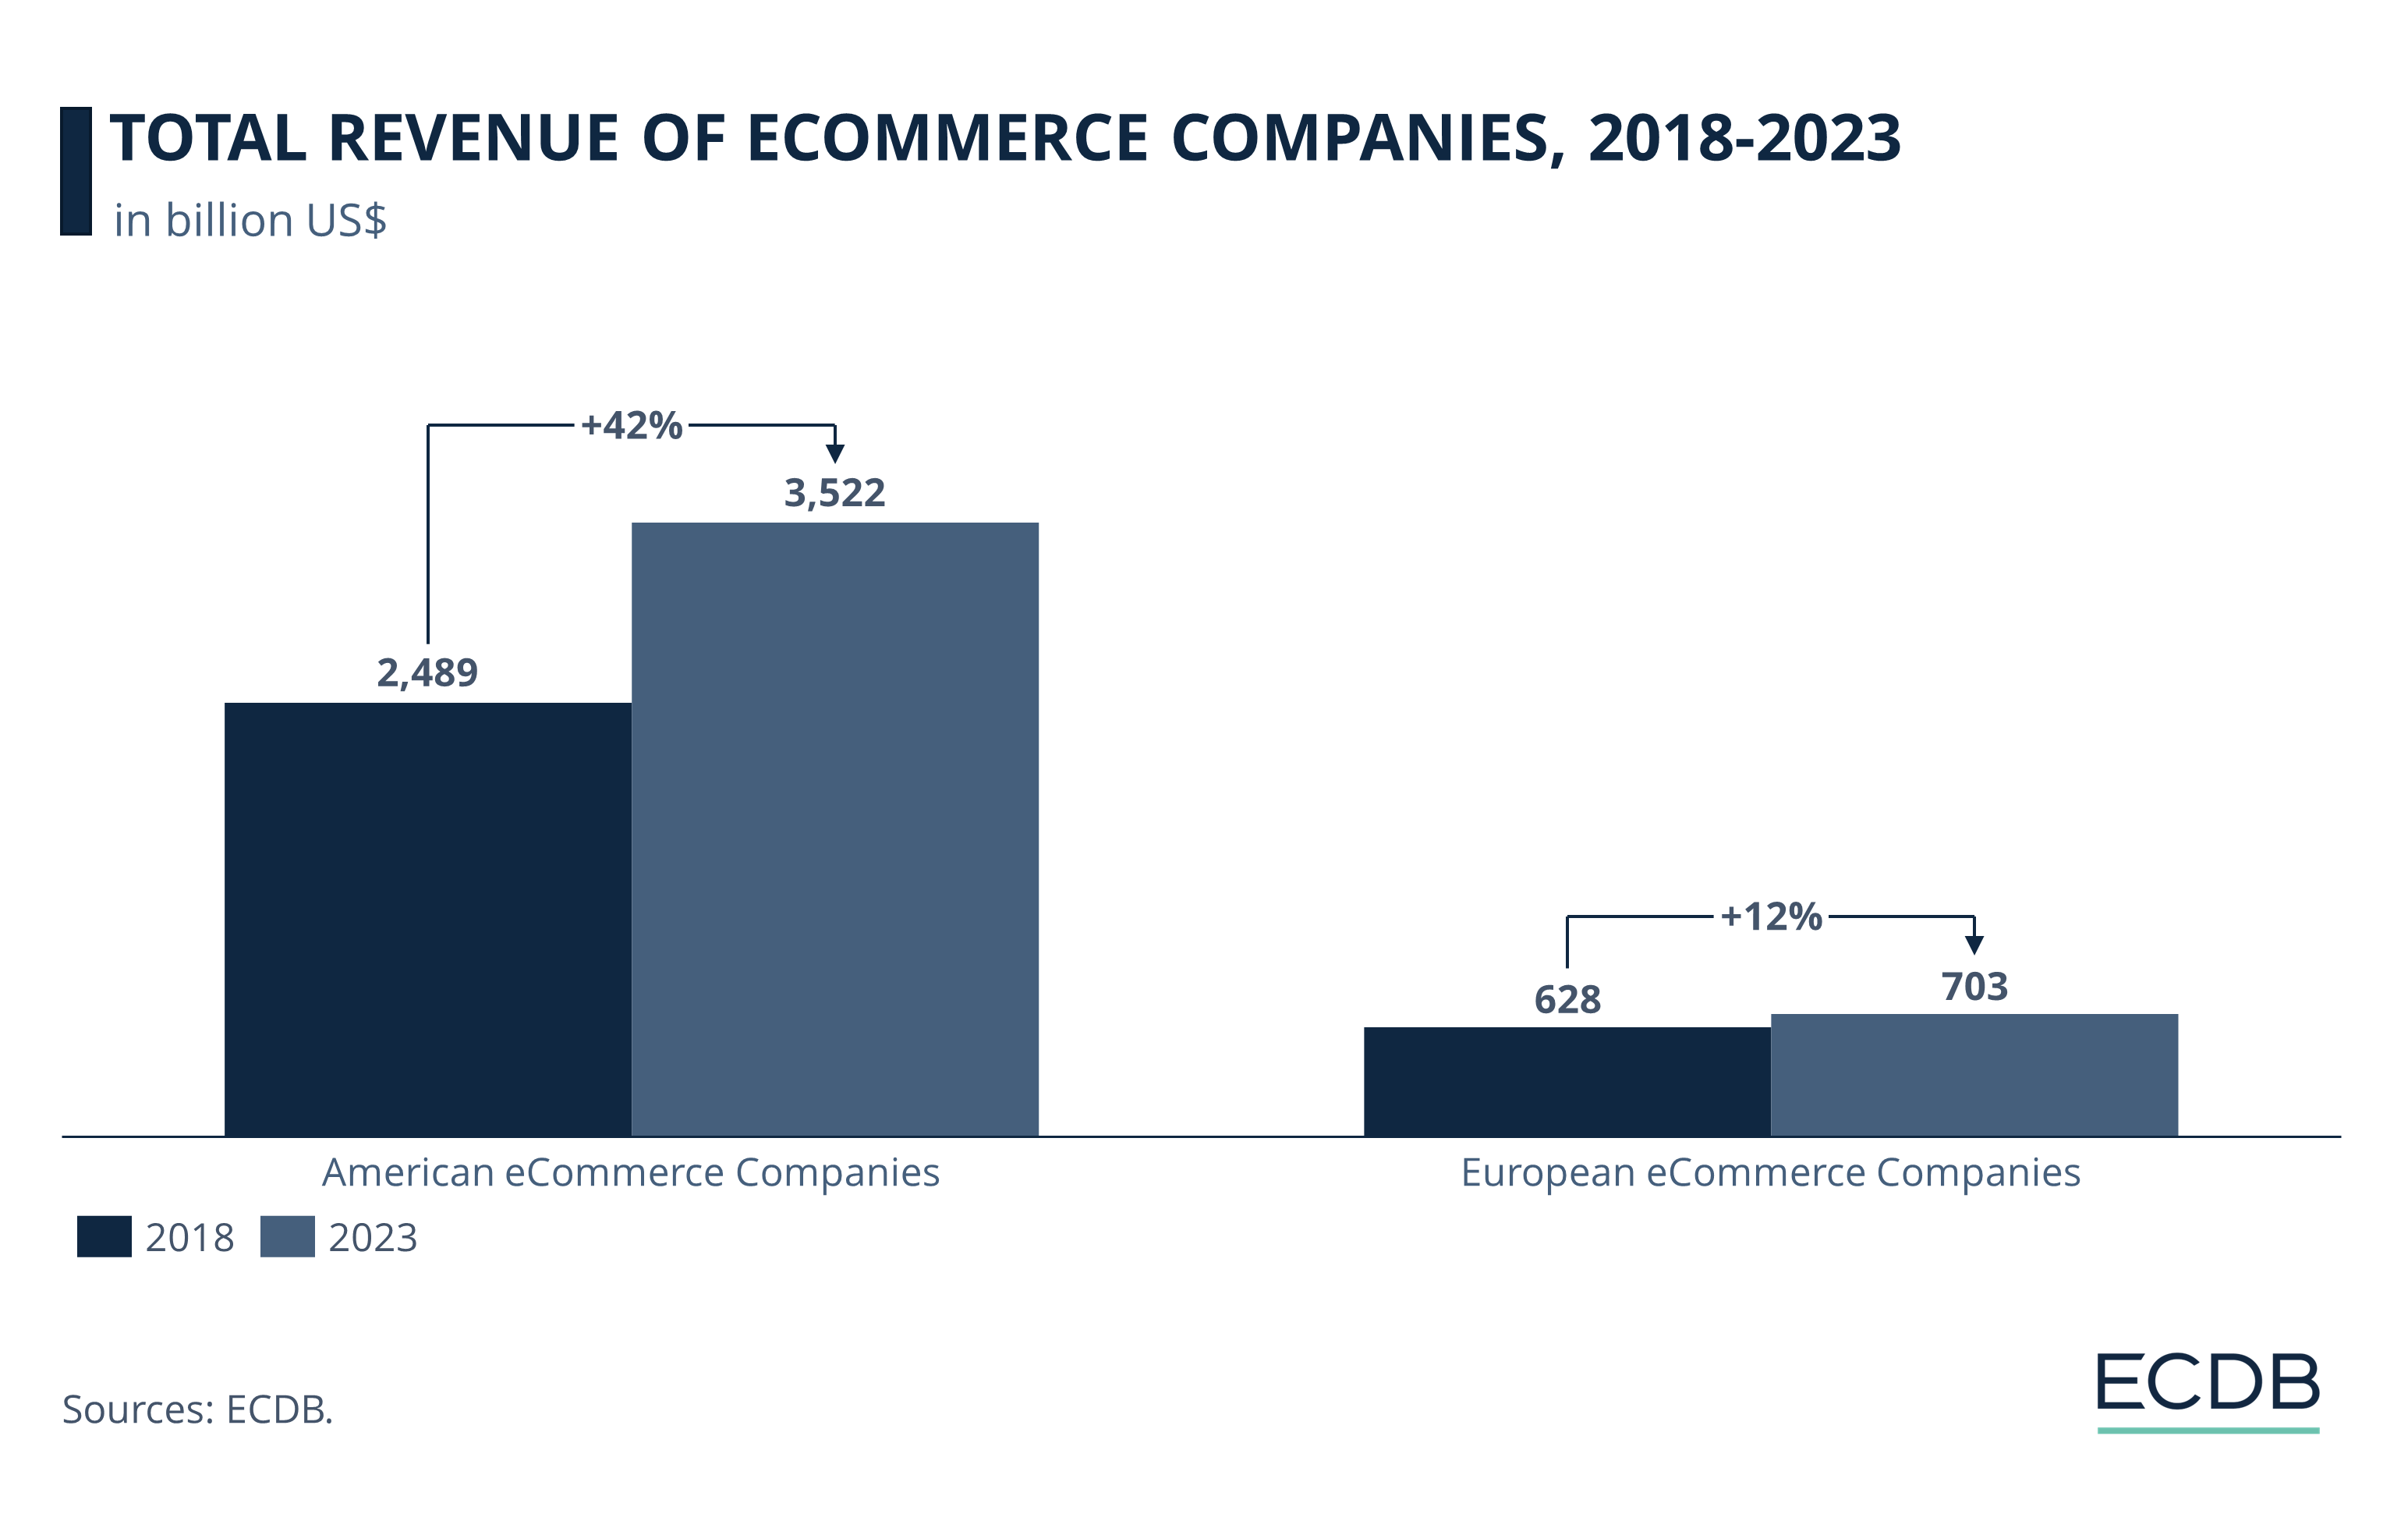
Even the Largest European Companies Are Growing Slower Than American eCommerce Companies
Regional activities can play an even more important role in determining growth for eCommerce companies. Different regions follow different economic trends influenced by consumer behavior and market saturation levels.
Cultural preferences and local competition also influence product demand and brand acceptance.
1. Business in Europe
It seems that companies with a significant business share in Europe are following the trend in the region.
Each additional percentage point of eCommerce sales generated in Europe slows growth on average by 0.06 percentage points with everything else remaining steady.
This means that an average company generating 100% of sales in Europe grows by just 6.6% per year compared to the global average of 12.6%.
The discrepancy is mostly explained by different market developments. European core markets such as the United Kingdom (5.8%), Germany (3.1%), or France (3.1%) all lag behind the global market growth of 9.2% in 2023.
Markets in Europe also tend to be more mature and saturated compared to Asian markets while the overall economic recovery has been slower than in the United States.
2. Business in America
Compared to business in Europe, eCommerce companies are profiting significantly from a strong presence in the Americas.
Every additional percentage point of revenue generated in American markets increases the growth rate on average by 0.05 percentage points.
This is demonstrated by some of the highest growth rates in eCommerce such as MercadoLibre, Inc. (CAGR of 164% since 2019) or DoorDash, Inc. (77%) being achieved by American companies.
Mirroring business in Europe, most of this is explained by market conditions. Even the biggest markets such as the United States (6.8% in 2023), Canada (13.6%) or Argentina (11.7%) are outperforming European countries in terms of growth.
Higher growth in the Americas is mostly explained by two factors: better post-covid economic performance (especially in the U.S.) and greater untapped growth potential (especially in South America).
There is no significant relationship between revenue growth and the share of business generated in countries of the Asia-Pacific (APAC) region.
One reason for that is the region’s highly diverse and fragmented market that can yield varied performance results for eCommerce companies.
eCommerce Company Growth: Closing Thoughts
The eCommerce industry has experienced impressive growth over the last five years. Key factors influencing revenue growth include total revenues, the extent of eCommerce activity, and market segments.
Regional differences also impact growth, with American companies generally growing faster than their European counterparts.
Understanding these growth determinants can help companies strategize for higher growth, specialize in high-growth markets, and target more dynamic regional markets.
In the future, the eCommerce market is expected to continue to grow, albeit at a slightly slower pace. Annual growth will decrease to just 7.5% by 2028.
But there are few signs that current growth determinants will change dramatically in the future. Growth estimations between Europe and the Americas are converging slightly until 2028, but growth rates across American markets are still significantly higher.
This implies a continued gap in growth patterns between regions. Grocery eCommerce is also expected to grow by about double the rate of the electronics segment over the next years, giving justification to future growth differences.
But there is some potential for additional shifts within growth dynamics. Just as in stock markets, there is a possibility that low growth in European countries is caused by temporary economic response instead of natural underlying constraints.
Or simpler: eCommerce in Europe has grown at a slower pace because companies made the wrong decisions in circumstances that were more challenging than in other regions.
This comes with an even simpler conclusion: since growth in Europe has been slower, there is more potential for growth in the future which could reduce revenue growth disparities.
While there is currently no connection between growth and business in the Asia-Pacific region, this could quickly change in the future.
India, Indonesia and Bangladesh are the fastest-growing markets with eCommerce revenues over the threshold of US$1 billion. As these countries continue to grow, they will produce more and more public companies active in the eCommerce space.
More companies with outstanding growth could then further alter growth dynamics – both between major regions and within APAC.
Lastly, there is a high possibility that current trends in eCommerce could affect growth in the future.
With social commerce on the rise, growth could shift to eCommerce companies with a large social platform or technological expertise.
This is also in line with the growing importance of marketplaces which favor the future growth of single retailers that can offer the most comprehensive ecosystem.
Click here for
more relevant insights from
our partner Mastercard.
Related insights
Deep Dive
The Global B2B eCommerce Market: Why It Is Beneficial to Sell to Other Businesses
The Global B2B eCommerce Market: Why It Is Beneficial to Sell to Other Businesses
Deep Dive
eCommerce in Indonesia: Revenues Projected to Cross US$100 Billion in 2025
eCommerce in Indonesia: Revenues Projected to Cross US$100 Billion in 2025
Deep Dive
Top 10 Online Shopping Sites in the USA: Amazon, Walmart, Apple
Top 10 Online Shopping Sites in the USA: Amazon, Walmart, Apple
Deep Dive
eCommerce Market in China: A Maturing Market & Unsustainable Price Wars
eCommerce Market in China: A Maturing Market & Unsustainable Price Wars
Deep Dive
Otto: Can the German Retail Company Maintain Relevance and Drive Revenue in eCommerce?
Otto: Can the German Retail Company Maintain Relevance and Drive Revenue in eCommerce?
Back to main topics